SFM

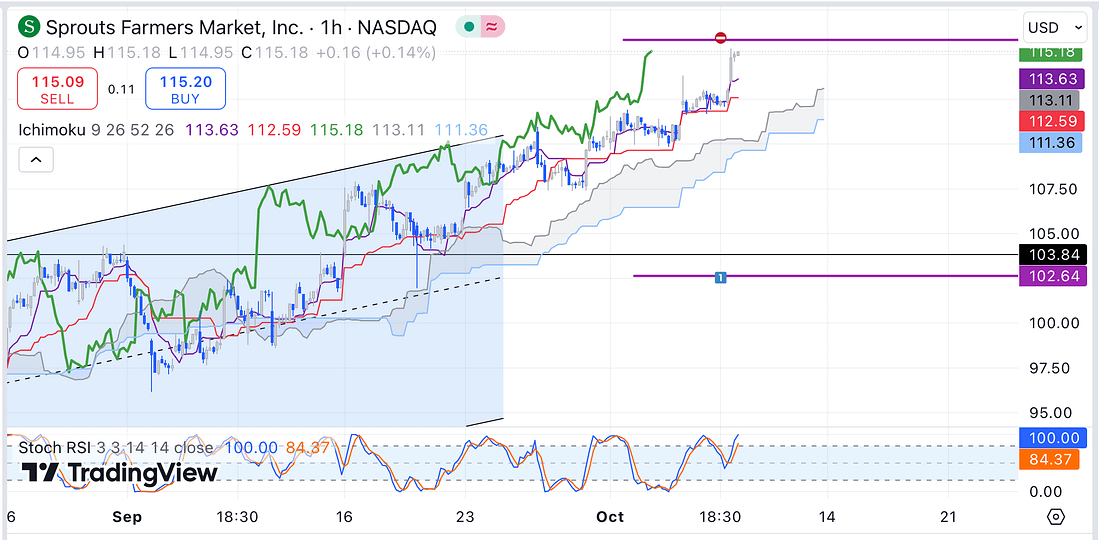
I decided, today, to exit the SFM position for the following reasons:
- The price action has not dropped as expected.
- The price action has shown increased buying strength on the 4 hour timeframe since I made my original entry.
- There is a possibility of a stop-hunt that would cause my stop-loss to be triggered with significant slippage cost.
Learning Point
To increase the probability of the trade being correct, in the future, I could wait for confirmation of the Ichimoku lagging span on the 4 hour timeframe.
Alternatively, I could use its weekly timeframe chart with the Fibonacci indicator in order to short all key resistance levels as the price continues rising.
Next Action
- Continue to monitor the price action of SFM everyday to keep up my learning process.
- Update new trading spreadsheet with losing SFM trade.
- Consider shorting SFM using the Fibonacci indicator on the weekly timeframe.
RUT

FDX

Today, I choose to scale in a 1/3 long entry in relation to FDX on the weekly timeframe for the following reasons:
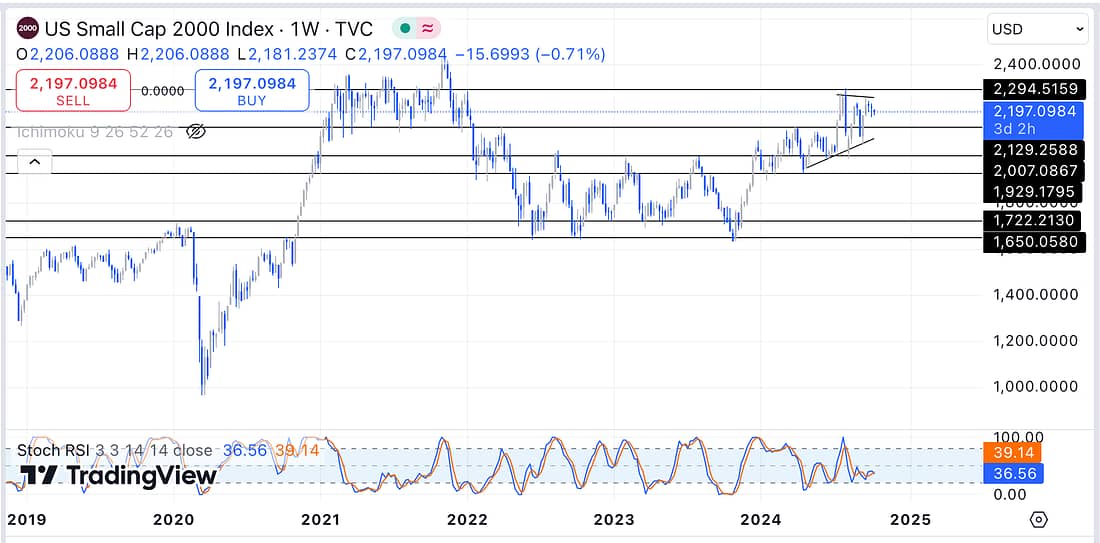
- The broader market (RUSSELL 2000) is showing a bullish consolidation on its weekly timeframe. This means, therefore, that it will be a higher probability trade if I go long any stock market company (minus tech stock) as oppose to going short.
- FDX’s weekly Stochastic RSI has turned bullish after reaching the oversold area.
- The price action of FDX appears to be predictable on the weekly timeframe in the respect that the price seems to be, consistently, bouncing off the relevant parallel trendlines.
Let’s see how this plays out!
Next Action
- Add additional capital to the trade if the market proves it to be correct.
- Continue to monitor the price action of FDX everyday to keep up with my learning process.
