Trading Journal
“First learn to trade then the money will follow!”
Today’s trading watchlist:
Monitor Current Trades
- GLD / XAUUSD
- AAPL
- NVDA
- TLT / US10 Year Yield
- LUV
- UAL
- BAX
- USOIL / USO
- SPY
- BTC / ADA
General Market Assessment
- DXY
- US10 Year Yield
- BTC
DXY

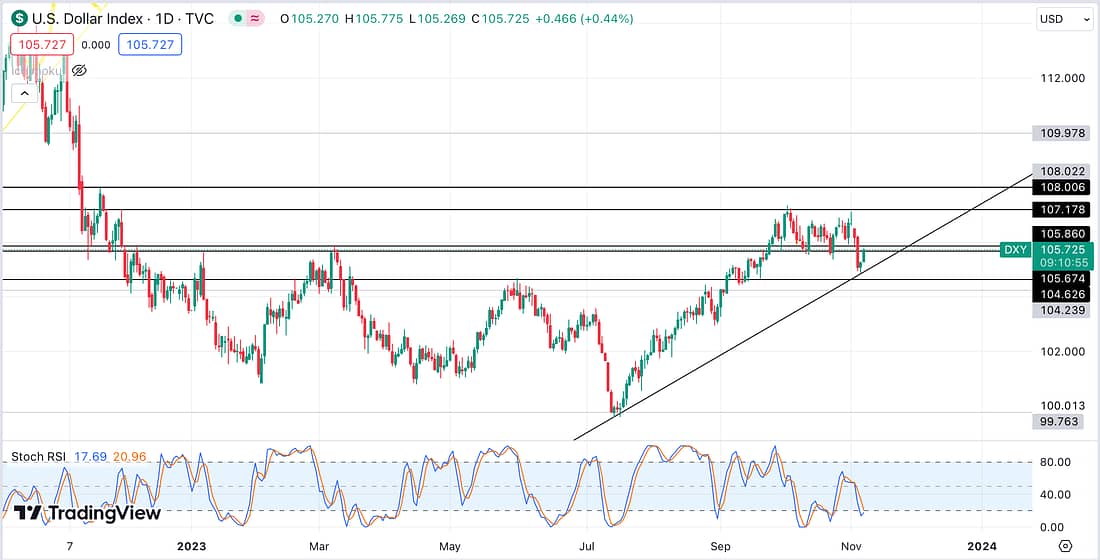
As shown above, expecting the DXY to rise to around 107.00 in the next few days (this week) in accordance with the trend line on the daily timeframe. This should mean that the stock market is likely to experience a price decline this week.
Advantageously, a stock market decline would be favourable for my following trades: NVDA, SPY, AAPL, and BTC / ADA.
Next Action
- Review the DXY again later today before the market closes.
- Assess the gold price (XAUUSD) and its ETF (GLD) to gain any better entries.
US10 Year Yield

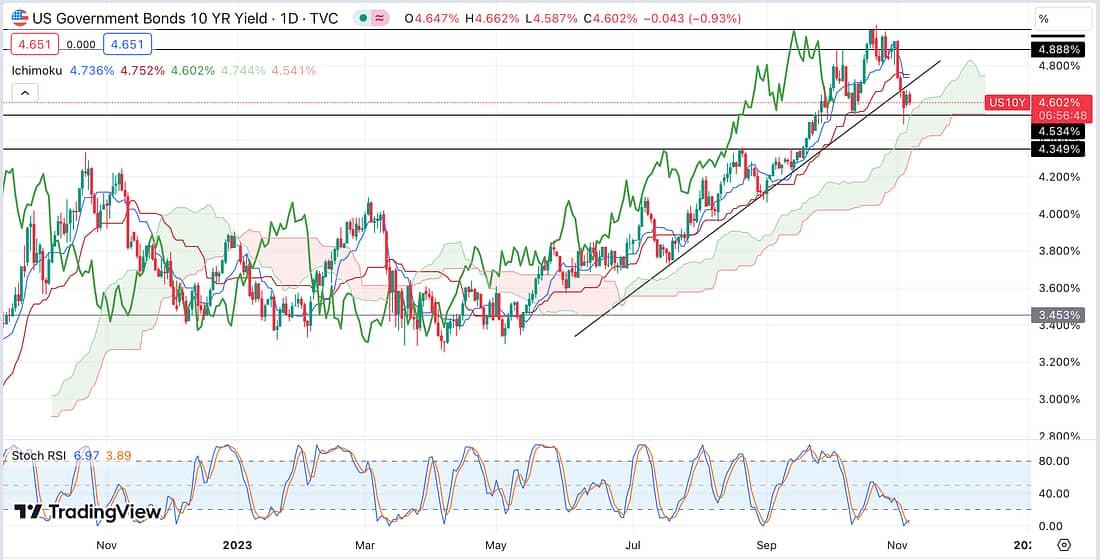
As can be seen by the lagging span (becoming entangled in the price action), I expect that the price of the US10 Year Yield will move sideways for the next few days (this week), probably between 4.5% and 4.7% before heading further down.
This will mean that my TLT trade will not be expected to move further into profit this week. Instead, it will probably be offering some better entry opportunities.
Next Action
- Assess TLT in order to take advantage of any better entry opportunities.
BTC

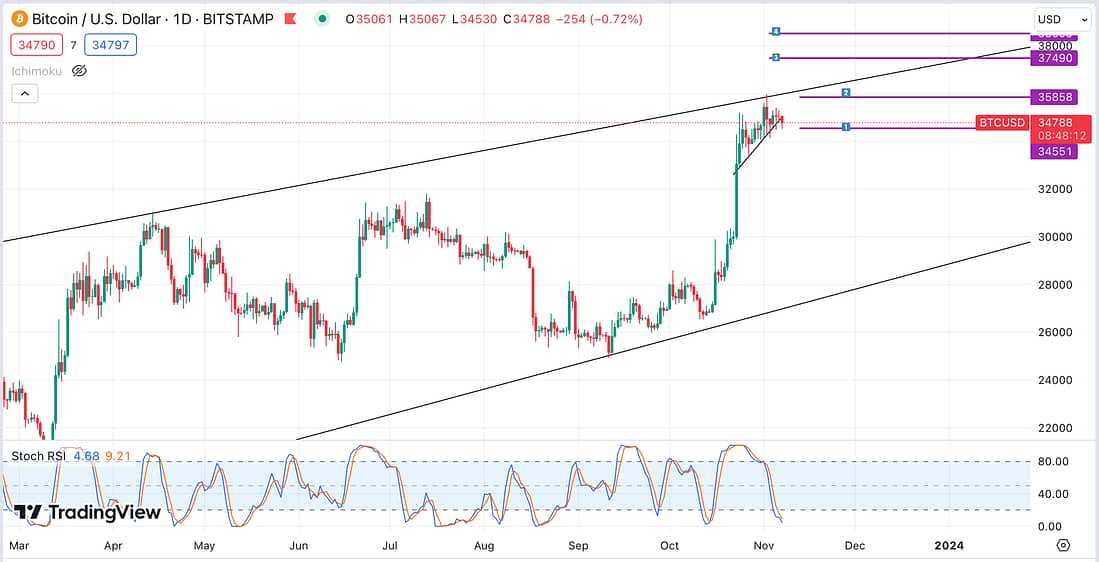
In line with the rise in the DXY, Bitcoin seems to be experience an expected decline in price. That said, it appears to be holding up really well in the circumstances, suggesting that there is still a lot of buying pressure.
Let’s see whether it can hold it currently position throughout the entire week. I doubt so in light of the fact that the DXY is expected to rise, but let’s see how it plays out.
ADA TRADE

As shown above, ADA has now stopped climbing, hitting my final entry order before declining. It appears that smart money had successfully hunted all of the possible stop-loss levels of retail traders.
This is precisely the reason why I choose to use a 1:1 risk to reward ratio for this trade. As 1:1 is the ratio that is least likely to be applied by other traders, as the reward is small, thereby increasing the odds that I would not be stopped-out.
Backtesting ADA also reveals that the Altcoin has the capacity to move aggressively before changing direction.
The daily Stochastic RSI is now moving, strongly, downwards. In spite of this, it is BTC that is ultimately dictating its price action. Therefore, I will let the price action of BTC continue to determine if and when I will take any profits or close the trade. So the price is expected to further decline over the next few days (this week).
Next Action
- Re-assess this trade later today, and tomorrow using the daily timeframe.
USOIL / USO TRADE
Today, I decided to set a take-profit level on my USO trade, as it seems due to hit its next major support level at 70.44.

As shown above, if the price of USOIL continues to decline, I anticipate that the price of USO will continue to breakdown causing my take-profit level above (green box) to be hit. As a result, I have also moved my stop-loss down to below my entry level, ensuring that this should be a profitable Short trade from here-on-out.
USOIL / USO TRADE – RE-ENTRY
In light of my take profit order (above), I have decided to also enter a going Long limit order at 70.68. This is because I expect the price of USO to rebound if it reaches this support level.

LUV TRADE


Due to the above charts, I decided to take full profits on my LUV trade for the following reasons. The monthly chart appears to indicate that there is still a lot of downwards sell pressure on the price of LUV. And the Daily timeframe suggest that it has reach a significant resistance level at 23.81.
In addition, the DXY seems due to go higher over the next few days in accordance to its current trend line. In general, this is expected to cause the stock market to decline; therefore, putting pressure on LUV to also peter out.
Next Action
- Update trading spreadsheet
UAL TRADE


For the same reason concerning my LUV trade (above), I decided to close my UAL trade, taking full profits.
UAL’s monthly chart reveals that there is still a lot of downward sell pressure on the stock, and its daily timeframe chart shows that the price has failed to break through a key resistance level at around 37.24.
Next Action
- Update trading spreadsheet
BAX TRADE

For the same reason concerning my LUV and UAL trades (above), I decided to close my BAX trade, taking full profits.
BAX appears to have reach a resistance level at around 34.27, whilst the stock market, in general, seems due to decline in the next few days.
Next Action
- Update trading spreadsheet
IVG (Involgize)