
Trading Watchlist:
1. BIIB – enter into a long trade in accordance with the 4 hour timeframe for the following reasons:
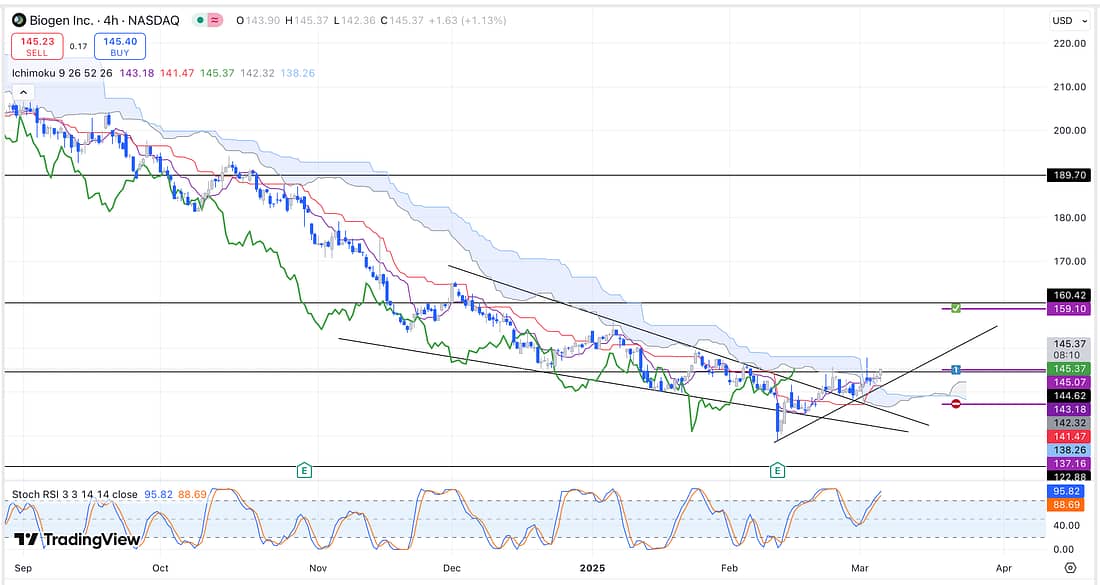
(1) I have been monitoring BIIB price action for the last few weeks or so.
(2) The price action of BIIB has been steadily grinding upwards and has now reached a major resistance level that looks ready to breakout on the 4 hour timeframe. That said, the price action does not look ready to rally on the daily timeframe. In fact, the daily timeframe suggests that this is going to be a false breakout.
In this respect, it is going to be very important for me to keep a track of the price action on the 4 hour timeframe.
(3) The overall market is declining and so this stock may be seen as a safe place to park some capital because the price has been really depressed for the last 8 months.
(4) The price action is at its 2012 price level suggesting that investors have been irrationally selling the stock so it is now overdue for a price appreciation.
Maybe the main lesson I am supposed to take from this trade is that I should really only focus on the highest probability trades in order to ensure that my equity curve keeps moving upwards?
Let’s see how this plays out.
2. NATGAS – analysed.
3. UNG – analysed.
4. UAL – analysed.
5. UVXY – analysed.
6. SOXX – analysed.
7. WOLF – analysed.
8. TSM – analysed.
9. PLTR – analysed.
10. MRNA – analysed.
11. PALL – analysed.
12. HOOD – analysed.
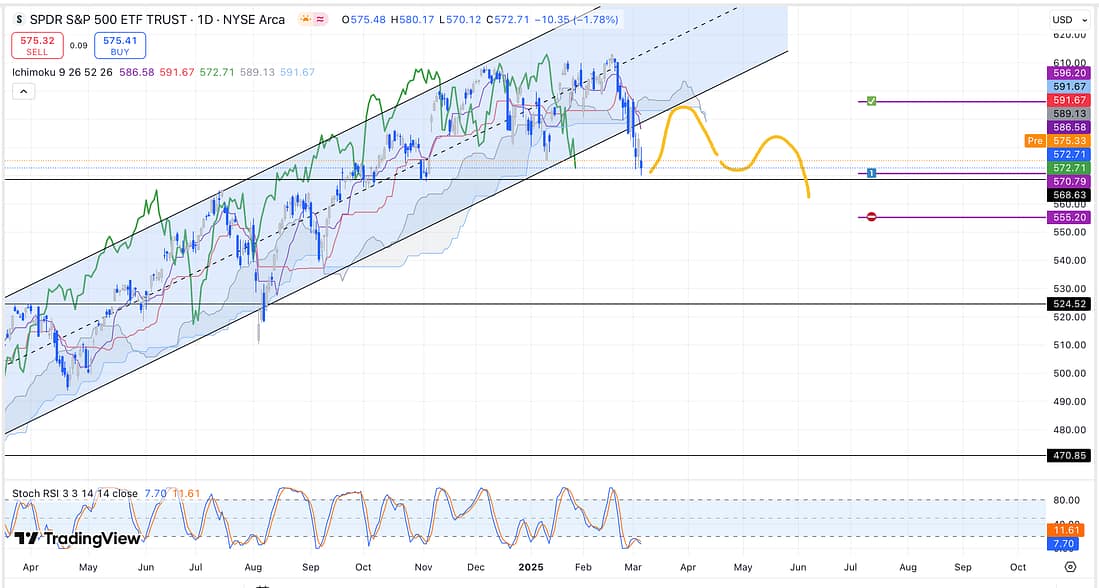
13. SPY – analysed:
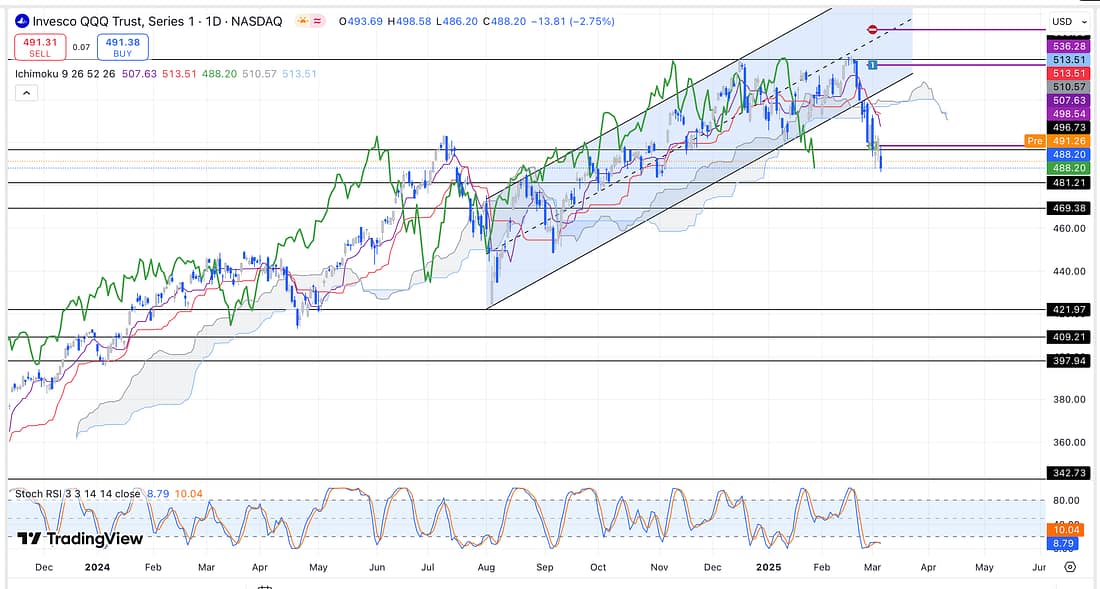
14. QQQ – analysed:
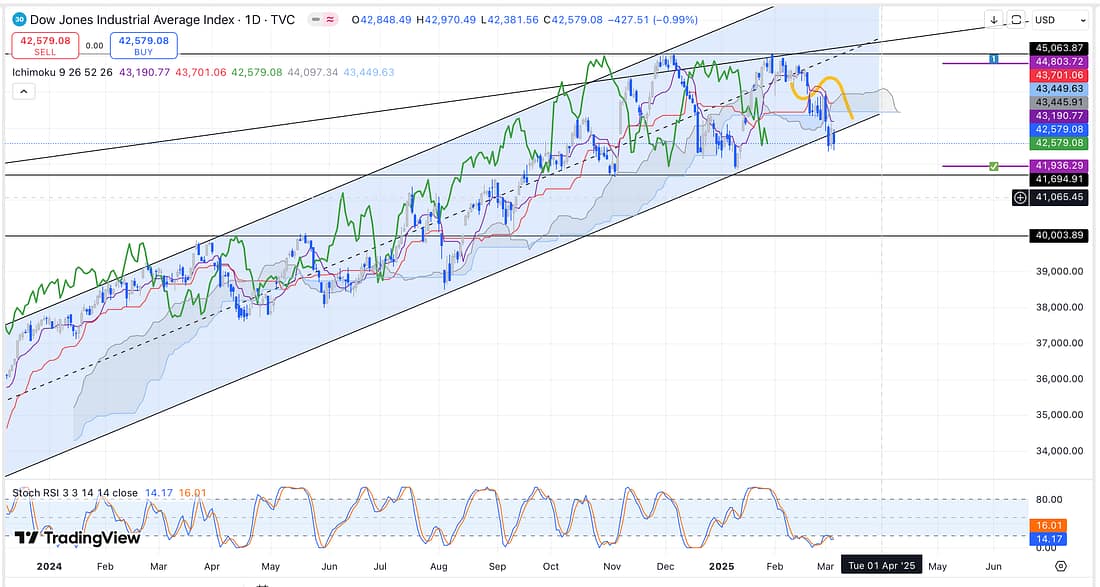
15. DJI – analysed:
16. RUT – analysed:
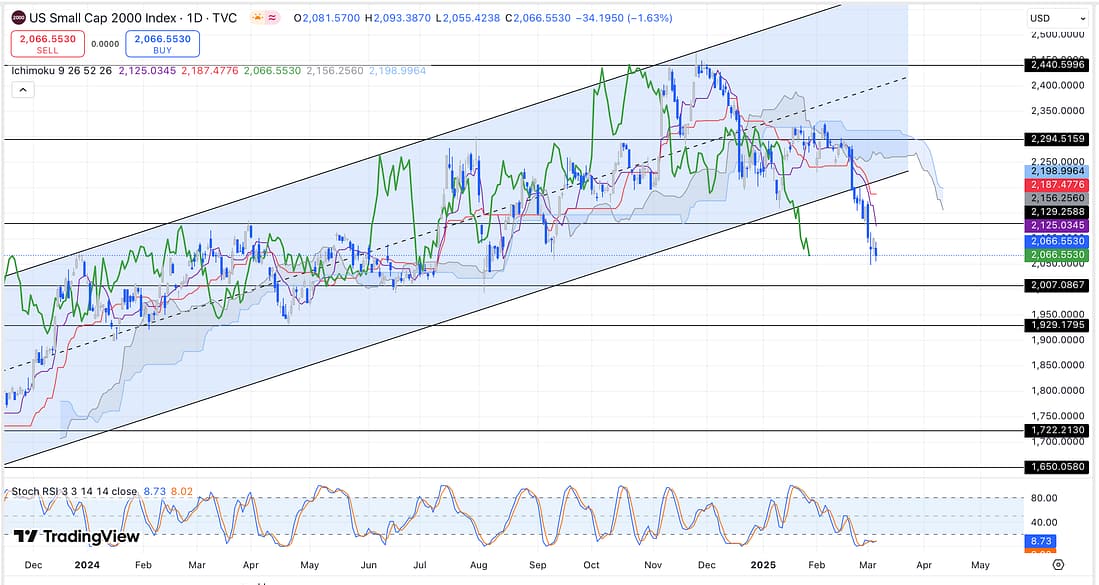
RUT is continuing to decline hard to the next major support level on the daily timeframe. Therefore, it may make sense to enter a UVXY position as soon as if a good position presents itself.
17. GE – analysed.
18. US10Y – analysed:
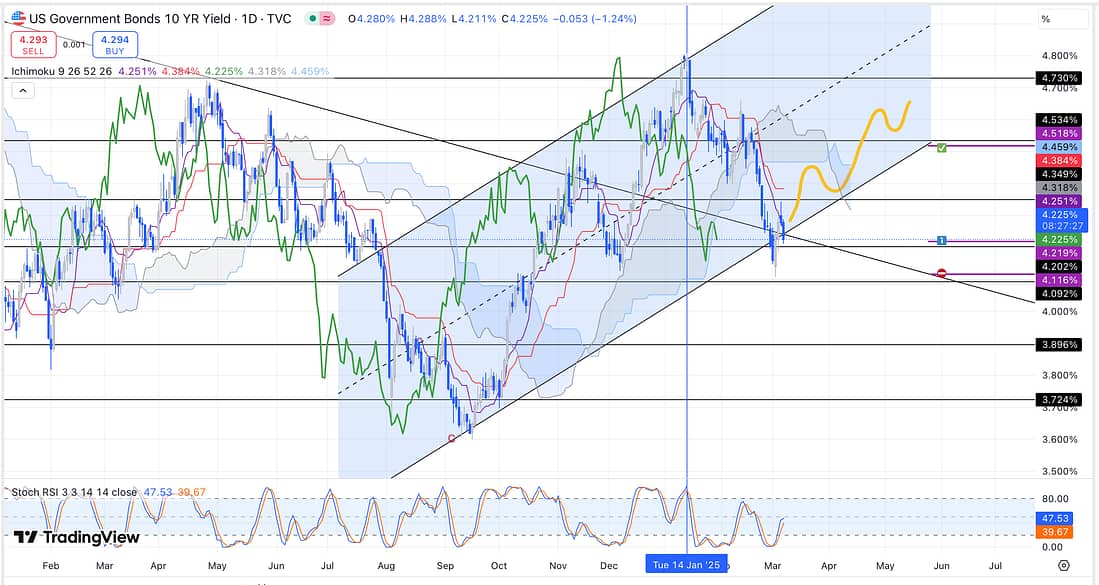
Start scaling into a TLT short position, as I anticipate that the US10Y will start rising again after its most recent sudden decline for the successive reasons:
(1) the 10 Year yields are now at a key area of major support from the parallel channel lower trend line,
(2) the parallel channel lower trend line is crossing over a longer term monthly support trend line, and
(3) its daily timeframe’s major support level passes through the parallel channel lower trend line, and longer term monthly trend line.
19. US10 – analysed.
20. TLT – analysed.
Learning Points
- Intriguing to learn that Moderna is a UK pharmaceutical company that started doing really well from COVID 19 UK government contracts.
Also, the fact that it is a UK company with the majority of it sells taking place in the US.
This is why I have always loved investing, as it provides an investor with a unique window (insight) into what is going on in the world.
- US10Y – Combining Elliott Waves technique with Parallel Channels is proving to be a powerful approach to predict price action movements.
Today, I was able to just refer back to my completed book review (Elliott Waves Made Simple) and immediately brush up my understanding of the Elliott Wave corrective wave phases.
Another confirmation that everything is coming down to writing, writing, and writing (including the creation of visual images).
Next Action
- Start scaling into a BIIB long as soon as possible.
- Watch today’s “Trading the Close”.
- Re-reflect on yesterday’s trading journal post and complete learning points section.
- Look into the company Moderna (MRNA).
- Start scaling into TLT short position when the markets re-open tomorrow.
- Screenshot RUT chart.
- Screenshot US10Y chart.
- Screenshot US10 chart.