Trading Journal
“First learn to trade then the money will follow!”
GLD / GOLD TRADE
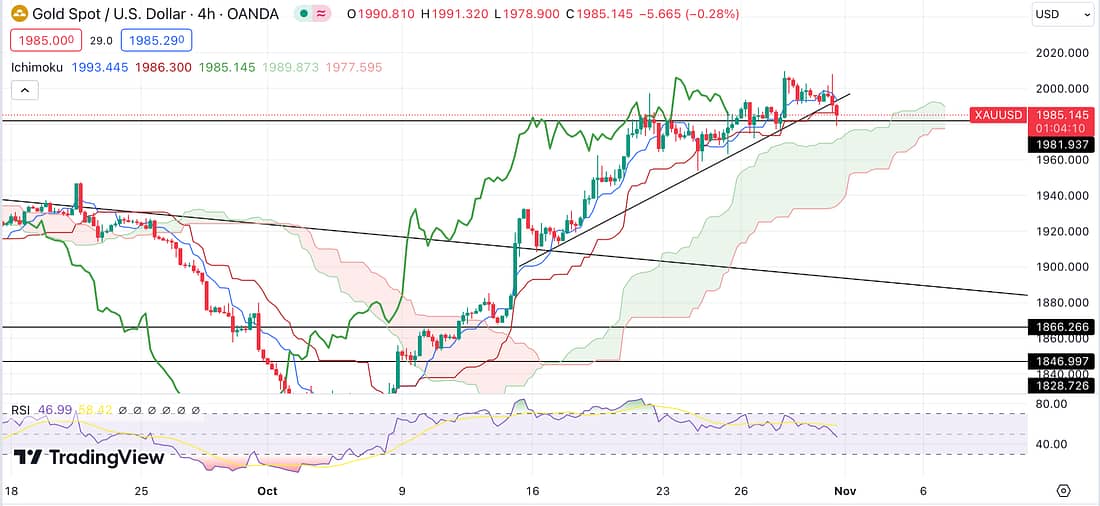
Assessing the Gold chart, I have been looking for a re-entry since last week in light of the current state of the world economy. The Gold price is expected to surge at some point in light of the accumulation that has been taking place by the world’s central banks. And the fact that the price of Gold had failed to decline significantly whilst the dollar was rallying over the last few weeks or months (Gold and the US dollar typically move in opposite direction. When the dollar goes up greatly, Gold tends to go down greatly. This did not happen over the last couple of weeks, as Gold only declined within a small range).
As can be seen below, after pulling back, the Gold price appears to now be ready to rally again from the current support trendline on the 4 hour timeframe.

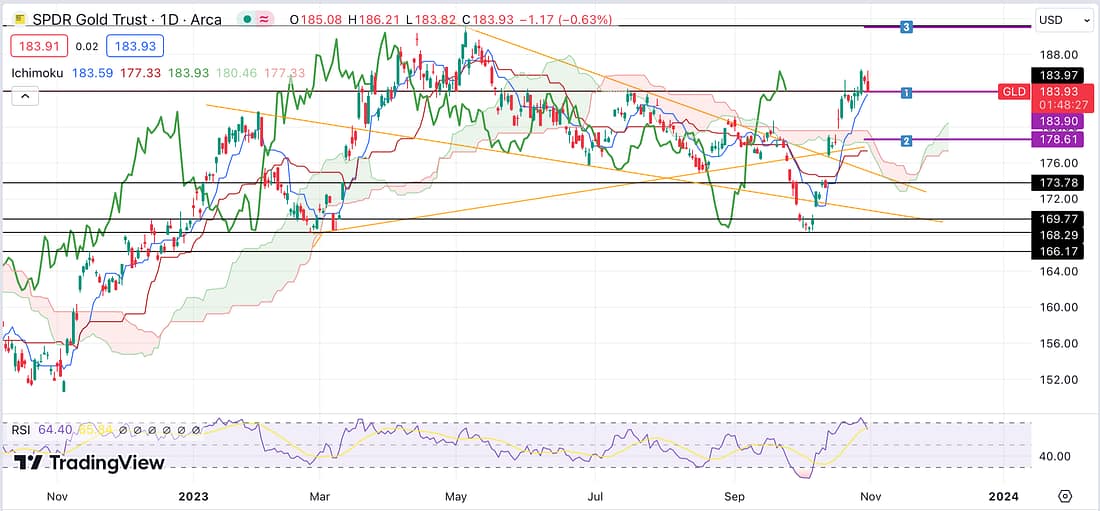
This create a perfect opportunity to enter the trade on the GLD (Gold ETF) as there tends to always be a delay. The ETF’s price does not mimic the price movement of the underlying asset immediately. Therefore, the GLD still appears to show the price of Gold declining when it has actually started to resume its upward price movement again.
As a result, I entered my position at purple line number 1, placed my stop-loss at purple line 2, and marked my take-profit level at purple line number 3:

Learning Point
- Initially, when I sought to enter a trade with the GLD, I had to stop and wait because the Gold Spot price was continuing to decline rapidly on the 1 hour and 4 hour timeframes. This created a strong possibility that the Gold price may have continued to declined below its current support trendline, causing the GLD, with it delayed response to the Gold Spot price, to decline even further.
Next Action
- Always ascertain the price movement of the underlying asset is stable before entering a trade on its equivalent ETF.
UAL, LUV, & TLT TRADES
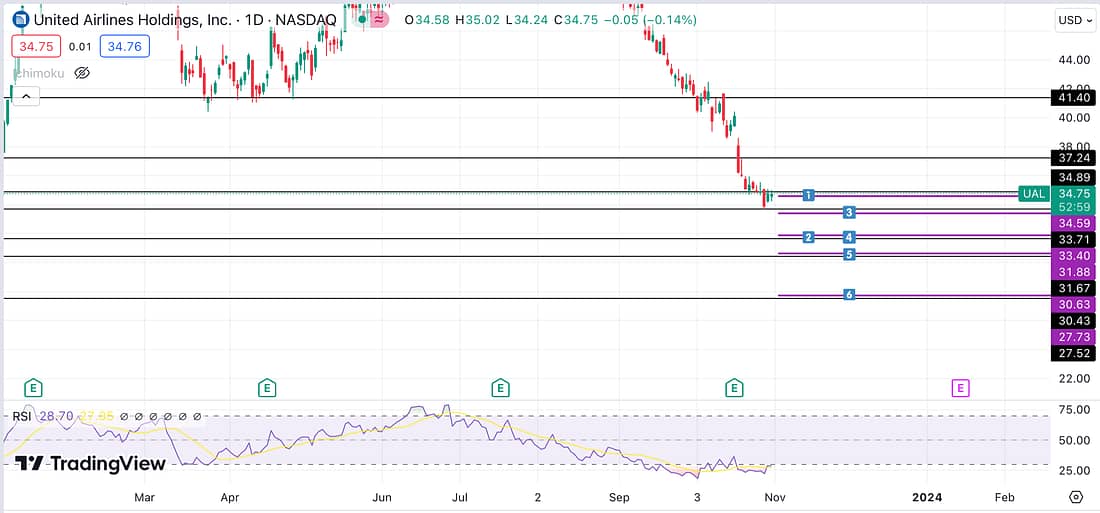
I am still in the process of perfecting my trading approach to financial markets that have experienced a tremendous, and somewhat irrational, decline in price.
Backtesting these type of price actions seems to reveal that at some point these stock or financial markets rebound hard. Just like an elastic band that has been overstretched. The longer the price declines then the more tension that is created, and so the stronger the price re-tracts.
The challenge is that we do not know, in advance, at what point the price is going to violently pull back. However, we do know that there are only a few highly probable trendline support levels that it is most likely to occur.
On the UAL, LUV, and TLT charts below, I have used purple lines with numbers to highlight those most probable levels.


Logic dictates that if I enter each level with about 1/6 of my position, then not only will I reduce the price of my overall entry (by dollar cost averaging in), but the price action should be likely to experience a strong rebound before I am able to enter my full position.
Learning Point
- When trading, it is within my interest to get as methodical and systematic as possible.
Next Action
- Continue to monitor the effectiveness of these trades (UAL and VAL)
VOO / SPY TRADE
Today, the SPY chart on the daily timeframe showed that the price had rallied above my entry level with a high probability of heading back to (the scene of the crime) the major trend line that it had declined from. In support, the lagging span was heading back to the same trend line without any obstacles in its way.
That said, I was initially curious as to whether the price action would stall at the major resistance line just above my entry level (purple line number 1), then resume declining again. This would make it unnecessary for me to close my trade immediately.

Assessing the SPY different timeframes (looking at the 1 hour, 4 hour and daily timeframes), I concluded that the probabilities were more in favour of the price continuing to rally back to the scene of the crime. As opposed to stopping at the resistance level, then resuming its decline.
Therefore, I decided to exit my trade immediately at a small loss. If I am wrong, then it will always be possible to re-enter the trade at, more or less, my previous entry price. This means that it is nonsensical to hold on my Short trade, as I risk sustaining a greater loss as the price action approaches my stop-loss (purple line number 2).
Learning Point
- The importance of using the trendlines on the daily timeframe to establish the most probable direction of the price action.
- The importance of looking at the trendlines, Kumo Cloud, Lagging Span, Tenkan, and Kijan on the lower timeframes to ascertain the current most probable direction of the price action.
IVG (Involgize)