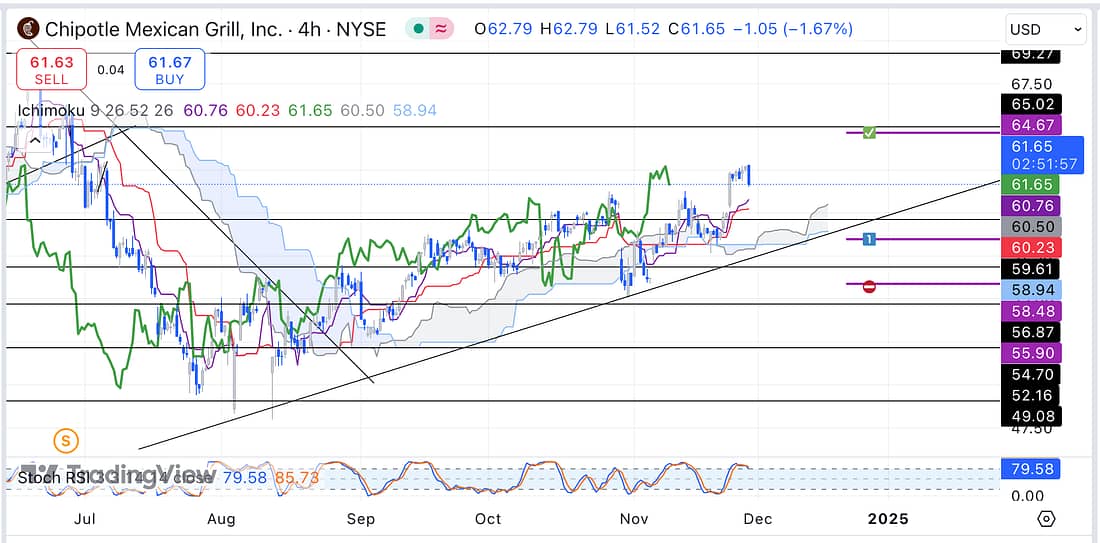
1. CMG – looks like it may almost be time to add additional capital to the CMG trade. Let’s see what the next 4 hour timeframe candle print does. If it declines, then add capital (check chart at 6.30pm GMT):

2. BTC – Bitcoin may still decline to the next support level. Let’s see what the next 4 hour timeframe candle print does.
3. MARA – analysed.
4. UVXY – analysed.
5. SFM – analysed.
6. INTC – analysed.
7. SOXX – still ranging on the daily timeframe; therefore, continue to stay active in the INTC trade.
8. MU – analysed: still ranging.
9. FDX – analysed.
10. DG – analysed.
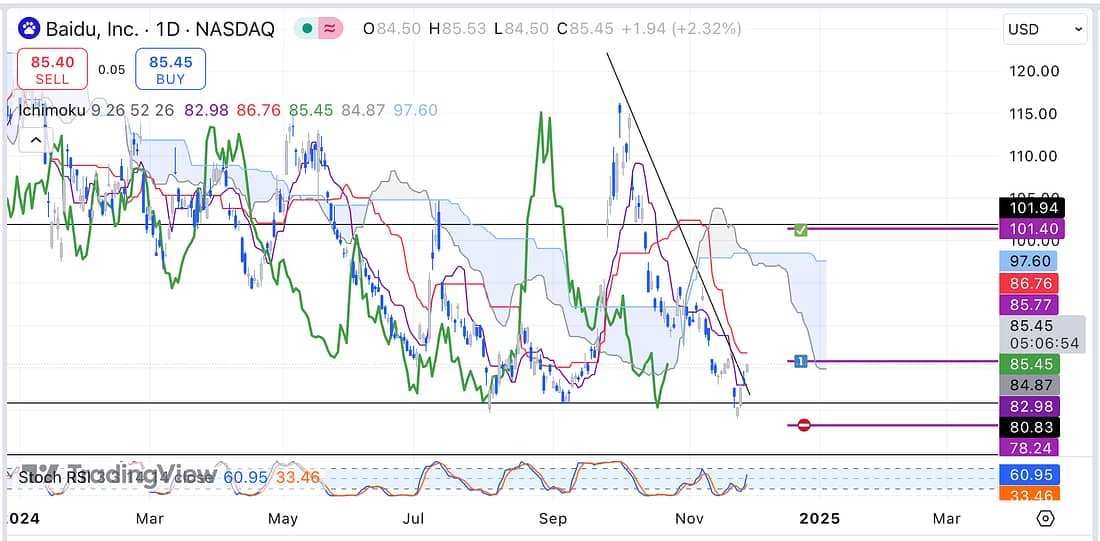
11. BIDU – go long BIDU in accordance to its daily timeframe:


12. RUT – analysed.
13. XAUUSD – analysed.
14. JETS – analysed.
15. USOIL – still ranging.
16. NATGAS – analysed: no man’s land on the daily timeframe so stay out.
17. US10Y – analysed.
18. TLT – analysed.
19. PALL – analysed on weekly timeframe.
20. UAL – analysed.
21. COST – analysed.
22. WMT – analysed.
23. AXP – analysed.
24. QQQ – analysed.
25. X – analysed.
Learning Points
- NATGAS – When the price action is in no man’s land on the daily timeframe, it is best to not trade to ensure that all trades have a high probability of success.
- The way that SFM, WMT, COST, AXP, UAL, and JETS have continued to keep grinding up, I would have lost a substantial amount of capital if I was trying to still catch an early short using only weekly price action trading (as I previously started doing).
Next Actions
- Open a long BIDU trade as soon as possible.
- Continue to watch the price action of SFM, WMT, COST, JETS, UAL, and AXP everyday to prepare to scale in a short on the 4 hour timeframe when ready.
