
Trading Watchlist
1. BTC
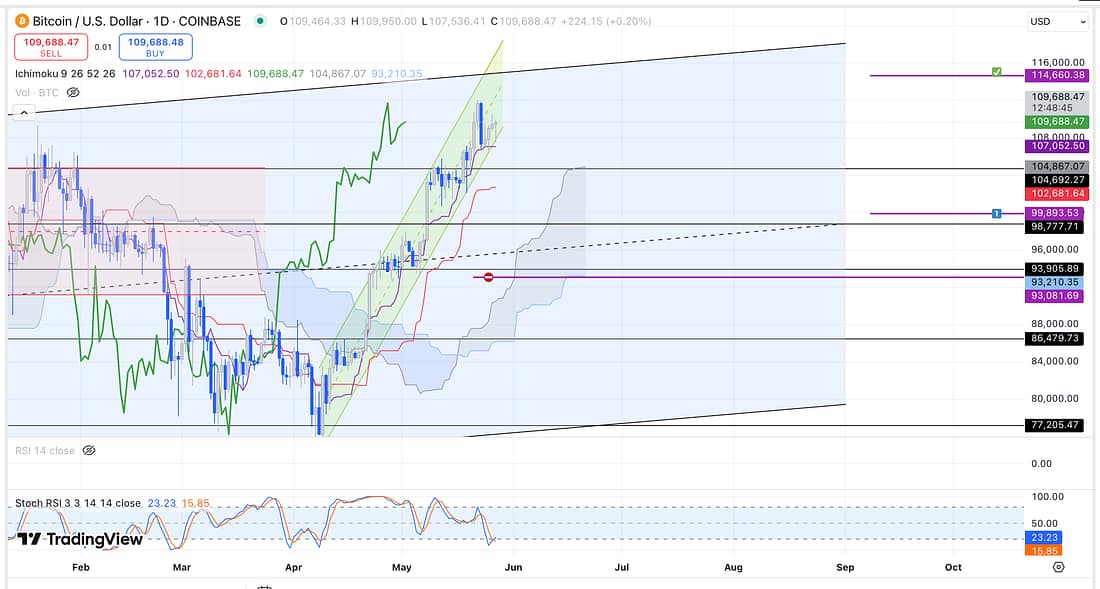
Both BTC and BTC.D look like they need to consolidate on the daily timeframe due to their recent, and very aggressive, rise.
2. BTC.D – analysed.
3. SOLANA – analysed.
4. XAUUSD – analysed.
5. SOXX
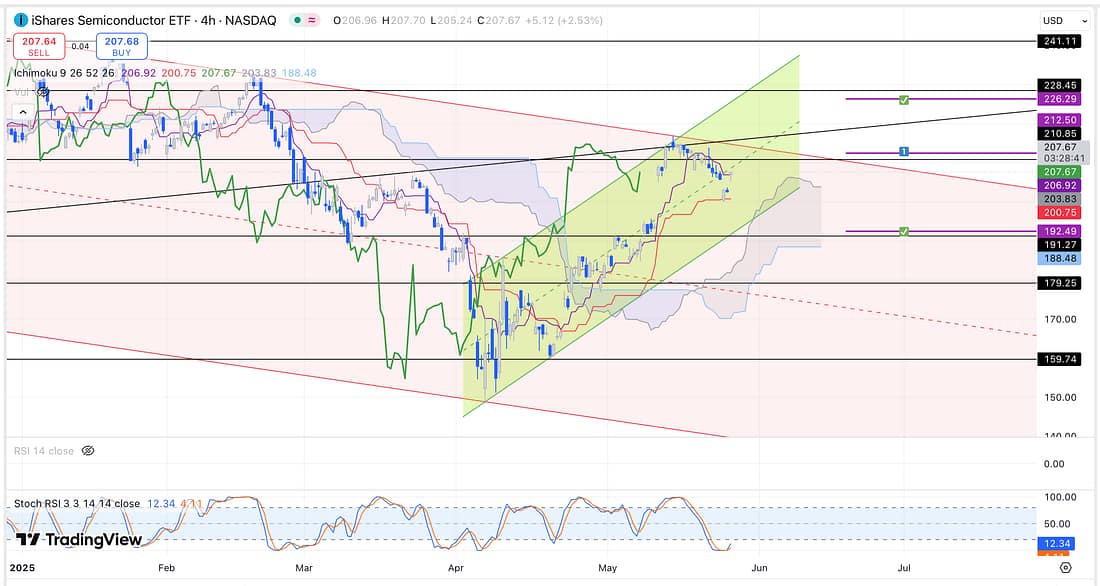
SOXX open higher today, confirming it bullish price action structure.
The result is that every other market should be expected to rise (“where the SOXX goes, everything else follows”) with the price of Gold simultaneously dropping?
6. QQQ – analysed.
7. SPY – analysed.
8. RUT – analysed.
9. CMG – analysed.
10. XAUUSD – analysed.
11. GDX – analysed.
12. NFLX – analysed.
13. BIDU – analysed.
14. TIGR – analysed.
15. AAL – analysed.
16. UAL – analysed.
17. JETS – analysed.
18. SOLUSDT – analysed.
19. UVXY – analysed.
20. SOXS – analysed.
21. US10Y – analysed.
22. TLT – analysed.
23. FETUSDT – analysed.
24. SOXS
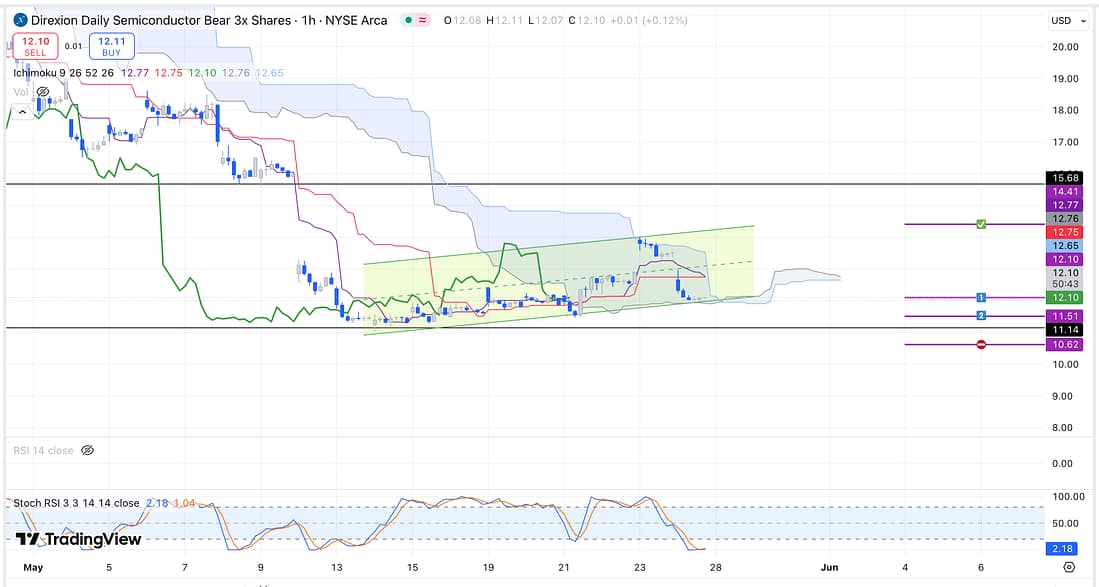
Start scaling into a short-term SOXS long trade immediately as there is a good possibility that SOXX will still decline in the super short-term, even though it is likely to still maintain its bullish price action structure on the 4 hour timeframe.
This trade will also act as a form of insurance for any unexpected sharp price action declines in the broader market.
25. UVXY
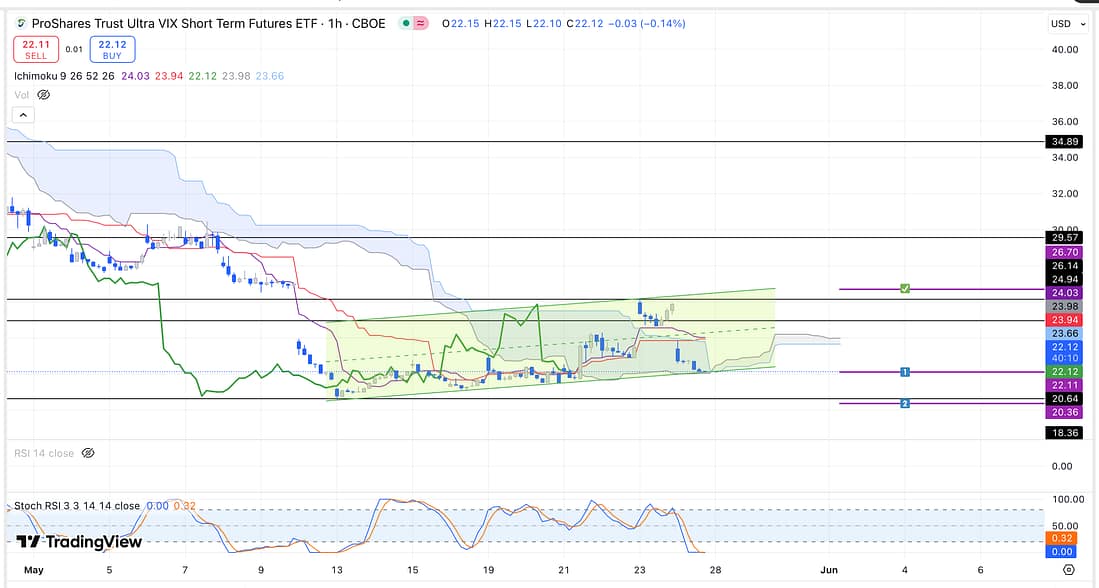
Start scaling into a UVXY short-term long trade, immediately, as there is a good possibility that SOXX will still decline in the super short-term (lower timeframes), even though it is likely to still maintain its bullish price action structure on the 4 hour timeframe.
This trade will also act as insurance along the SOXS short-term long trade (above).
Learning Points
- In theory, if probability favours SOXX‘s going up in the longer term (4 hour timeframe), then this should still cause its price action on its 1 hour timeframe to rise and fall in accordance with a micro parallel channel.
If the price of SOXX‘s rises and falls in relation to a micro parallel channel, then this should also cause SOXS and UVXY to likewise move in tandem.
As a result, to test this theory, I entered into two long positions in regard to SOXS and UVXY because both assets had reached the bottom of their micro parallel channels.
If my theory is correct, then the price action of SOXX on the 1 hour timeframe (in turn) should have reached top of its micro parallel channel?
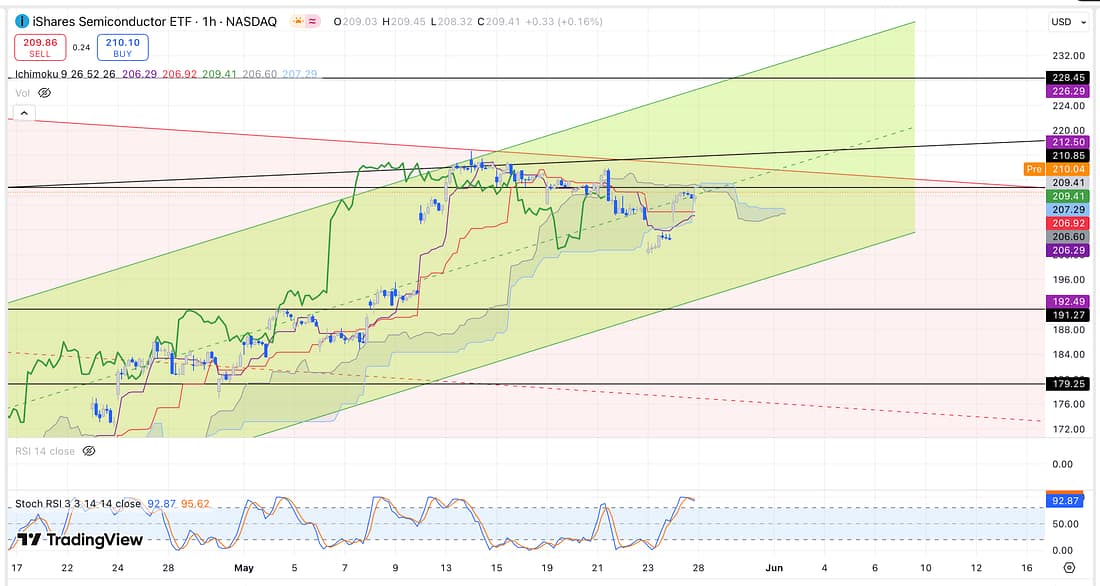
- As can be seen above, the price action of SOXX has actually reached the centre of its parallel channel on the 1 hour timeframe.
Ordinarily this would decrease the odds of the trade succeeding, because it is when the price action is at the top or bottom of a parallel channel that it has a higher probability of moving in the anticipated direction.
In spite of this, the middle of SOXX‘s parallel channel is an area where there is a lot of resistance due to the following:
(1) the presence of the top of a larger timeframe declining parallel channel,
(2) it is an area where a major long-term (monthly) diagonal trendline is present, and
(3) the ichimoku lagging span on the 1 hour timeframe is caught in the price action – not free and clear to rise as of yet.
It is for these reasons, that I conclude that probabilities favours the price action moving to the downside before any possible future price rally.
Let’s see how this plays out.
. - Being able to trade well really does entail, psychologically, walking through (writing out) the steps necessary to strengthen the relevant trading style or method that is being applied.
By doing so incrementally everyday, it will inevitably become a mentally complex but automatically honed activity, which would be almost impossible for others to replicate instantly without some form of training.
. - Re-acknowledged that I only require one trade, or detailed trading analysis, a day to get me to my desired destination.
Next Action
- Scale into a SOXS long trade in the short-term (1 hour timeframe) as soon as possible.
- Scale into a UVXY long trade in the short-term (1 hour timeframe) as soon as possible.
- Continue to closely monitor the price action movement of SOXX on its 1 hour timeframe.