
1. BTC – ranging:

Expecting BTC to fall to the next support level at $90,000 before it rebounds back up to the next resistance level above.
2. BTC.D – analysed: BTC dominance starting the move sideways.
3. SFM – analysed.
4. AXP – analysed.
5. WBA – analysed.
6. COST – analysed.
7. WMT – analysed.
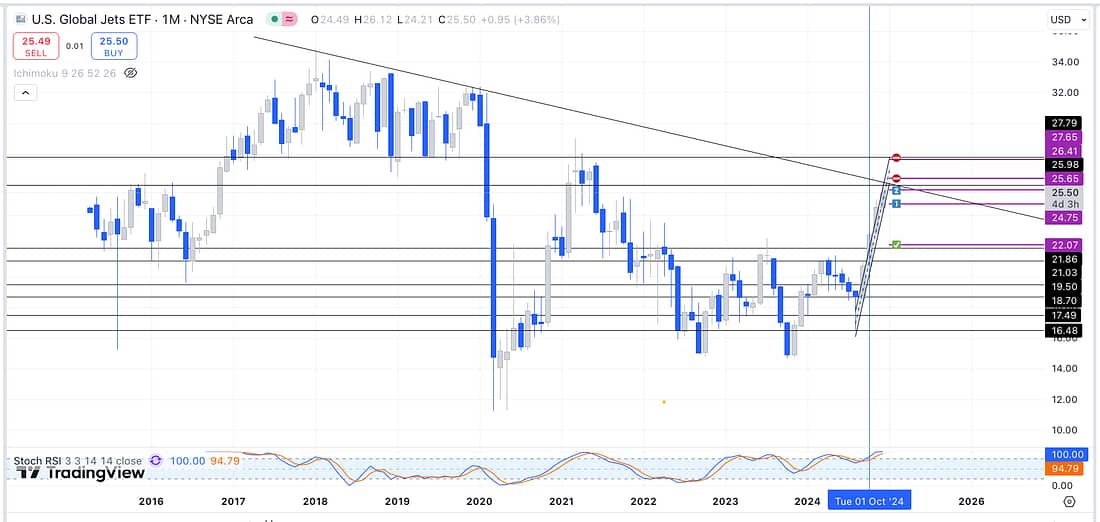
8. JETS – analysed: it made sense to add to my short position in light of the trendline on the larger timeframe being backed up by the resistance level on the weekly timeframe:
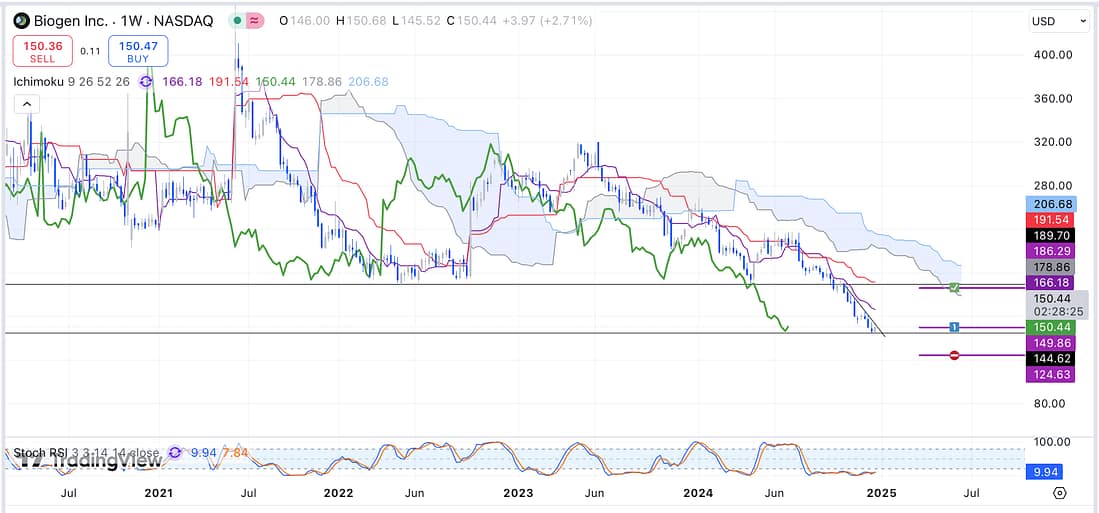
9. BIIB – in accordance with the daily timeframe, and a potential January price action pop, enter a BIIB trade as soon as possible:
10. UAL – analysed.
11. INTC – analysed: it rallied about 10% on the daily timeframe after the price action hit the major support level.
12. SOXX – still ranging.
13. DG – analysed.
14. TIGR – analysed.
15. BIDU – analysed.
16. FDX – analysed: ranging.
17. CMG – analysed.
18. QQQ – analysed.
19. RUT – declining on the daily timeframe.
20. UVXY – analysed. I guess it is likely to continue declining during this holiday period, as the markets are quieter than usual because the institutions are on holiday. However, when the markets re-open, I would expect the UVXY to spike up due to increased market activity.
21. MARA – analysed.
22. XAUUSD – analysed: it is ranging on the 4 hour and daily timeframe.
23. USOIL – ranging.
24. NATGAS – analysed using a parallel channel: let’s see how this plays out.
Learning Points
- Combining Gareth Soloway’s trading videos, with my growing trading experience, enable me to better appreciate the importance of the following:
(1) using converging trendlines on the larger timeframes (3 month, and monthly) and smaller timeframes (weekly, daily, and 4 hour) to detect high-probability areas or levels, which will almost guarantee that the price action will start to decline or rally. My JETS short appears to be a perfect example of this approach at the moment:
- As can be seen above monthly timeframe indicates that the price action is approaching a strong area of resistance, which is backed up by a weekly timeframe resistance level in the same place.
Gareth Soloway argues that when you have multiple factors (measured moves, topping tails, trendlines, Fibonacci, major moving averages, and so on) then it creates the following odds of success:
(1) One factor – 50/50
(2) Two factors – 70/30%
(3) Three factors – 80/20%
(4) Four factors – 90/10%
– - In light of the above, it may make sense to submit several 1/3 short or long entries at the major resistance or support area, before waiting for the price action to confirm that the trade is correct. This is obviously the opposite approach to making an entry then waiting for the price action to reveal that the trade was not wrong, then adding additional capital (at least once) on any pullbacks.
- Using multiple factors to enter a trade also seems to favour daily timeframe trading. In other words, exiting the trade when it hits the next major resistance or support level).
Next Actions
- Enter a BIIB long trade as soon as possible.
- Watch Gareth Soloway’s latest trading video to continue acquiring trading knowledge and experience.