Trading Journal
“First learn to trade then the money will follow!”
1.54pm EST
Today, I am trying out the habit of forming an everyday trading watchlist. My current watchlist on the daily timeframe consists of the following:
General Market Analysis
- US 10 Year Yield
- DXY
Looking for Trading Entries
- GLD (XAUUSD)
- NVIDA
- UNG (NATGAS)
Monitoring of Current Trades
- UAL
- MANA
- BTC
- BAX
- HSY
- TLT
TLT TRADE
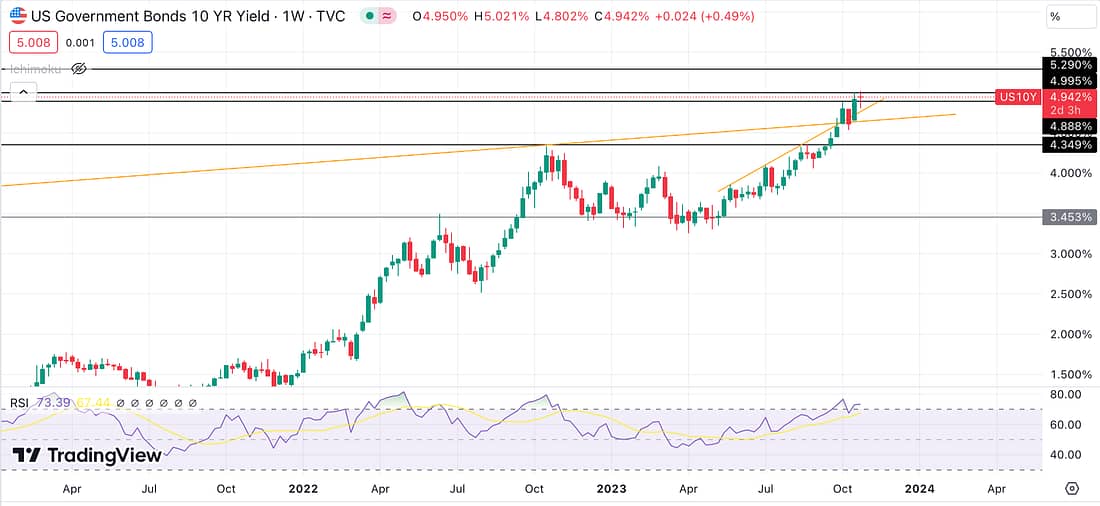
Assessing the 10 Year Yield, its price has still not declined as expected. In fact, it has rallied upwards again in what appears to be an unsustainable run.

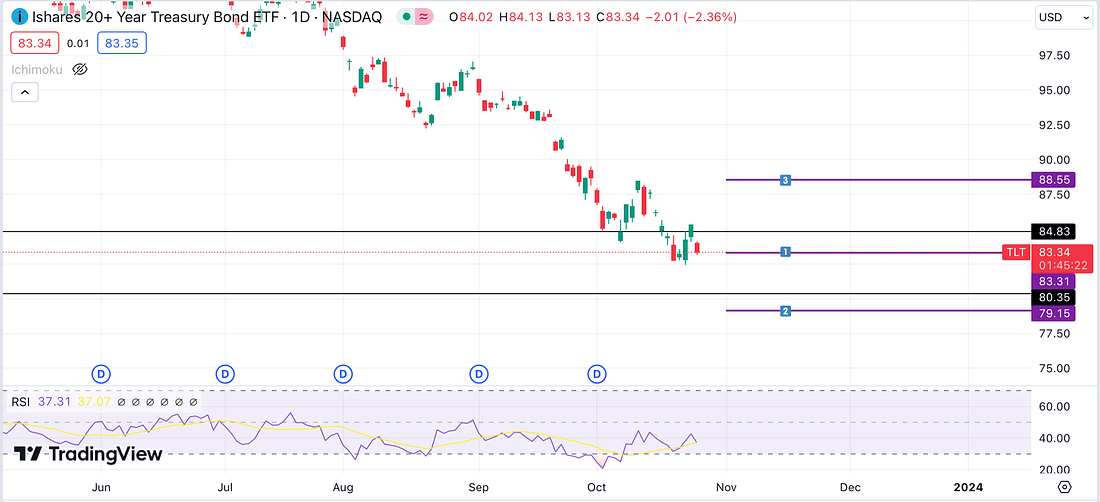
As can be seen on the weekly timeframe above, it seems due for a significant 10% reversal at the least. As a result, I have decided to enter another 1/6 of my capital to my existing Long position on TLT, which moves in reverse to the US 10 Year Yield.

As shown above, my entry is purple line one, my stop-loss is purple line 2, and my take profit area is purple line 3. The risk to reward ratio is a high probability 1:1 trade.
Next Action
- Update trading spreadsheet.
NVIDA TRADE
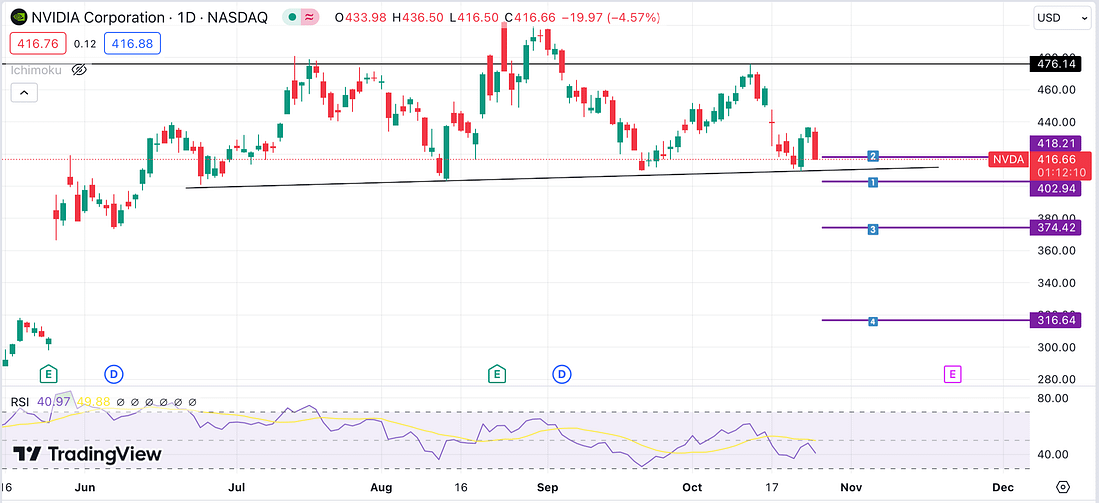
The NVIDA trade setup seems almost ready so I have entered my entry order with stop-loss and take-profit areas (purple line number 3 and 4):

If the trade plays out according to plan, then it is to be expected the price will breakdown below the black support line. This will cause the price too rapidly descend in line with the head and shoulders pattern that seems to have formed. It is expected that price will eventually decline to fill the earlier gap that is present on the chart (left hand side), which works out to be the same distance from the top of the head and shoulders pattern to the black support line. Let’s see what happens!
I decided to enter 1/3 of my position for this trade.
BTC & MANA TRADE
Bitcoin appears to still be holding on to a bit of bull strength, yet, it is still weakening. Let she how it continues to play out. If it plays out according to plan, then a volatile price decrease will in-turn cause my MANA short trade to also succeed.

It intriguing how the 4 hour timeframe creates the impression that the price is likely to rally higher towards my stop-loss easily. Whereas the daily suggests otherwise. Let’s see which one reigns supreme. Technically, it should be the daily timeframe, but let’s see if it holds true!
VERIFIED INVESTING
Key Learning Point
- Use the weekly timeframe to set take-profit targets when prices rebound or reverse concerning swing trades.
- Whatever timeframe you ultimately use to make a trade, use that timeframe’s levels to decide on your exit.
- Gold consolidating so look for a re-entry, if the lagging span appears to be due to cross the upper trend line.
Next Action
- Monitor watchlist tomorrow.
- Assess shorting GLD (Gold) tomorrow.
- Watch Verified Investing’s trading video tomorrow.