USOIL

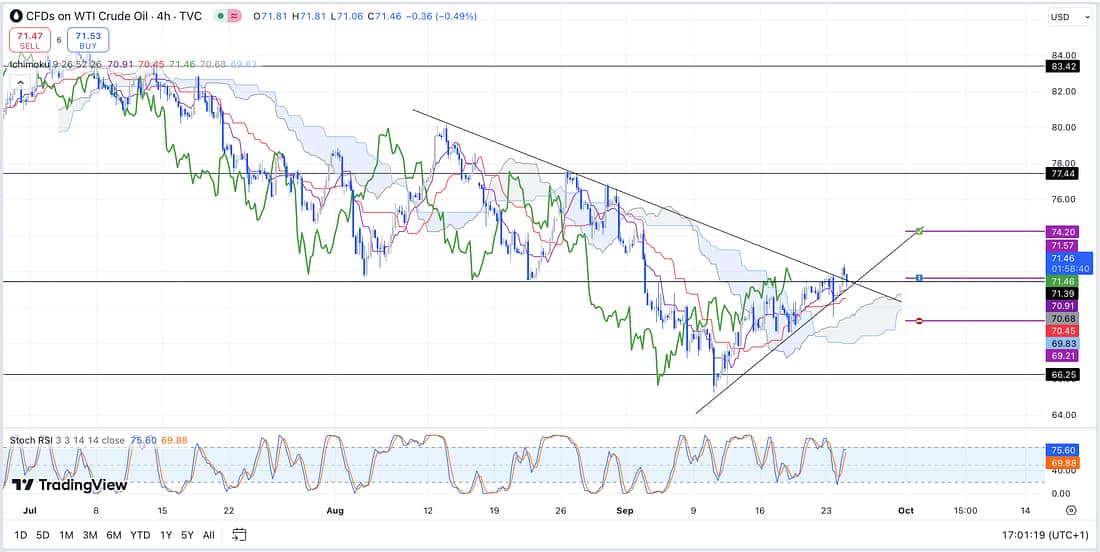
Today, analysing the USOIL chart on the 4 hour timeframe (above) revealed that there is a good possibility that the price action will continue to rally for the following reasons:
- The lagging span has broken out of the Kumo Cloud, and so is free and clear to move aggressively to the upside.
- The price action has been steadily moving up along the diagonal trendline.
- The price of oil had declined greatly for the last few weeks, therefore, increasing the odds that it is due for a significance pull-back, favouring its continued price rally.
- Fundamental news suggests that China has now stimulated their economy by lowing interest rates. This should have the affect of increasing the demand for oil, which drives their large economy, thus causing oil price to rise overall globally.
- The price action of USOIL is currently at a key support level.
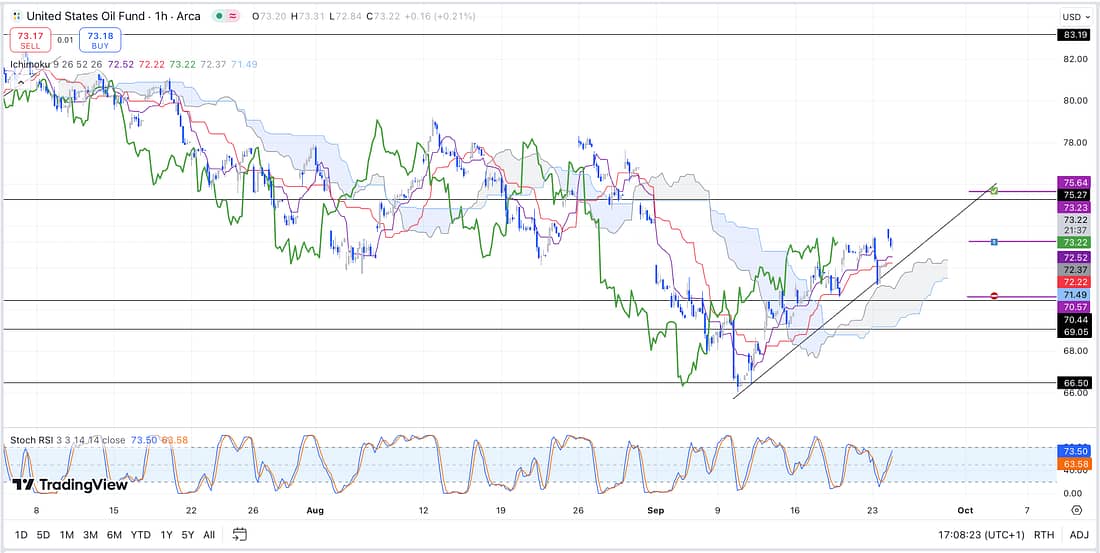
As a result, using the USO (USOIL ETF), I have now scaled in to a position with only a 1/3 entry, just in case I am wrong, and I will look to add further capital to the trade if the price rallies then experiences a pull-back along the diagonal trendline:
USO

Intriguingly, USO’s 1 hour timeframe shows the same chart pattern as USOIL, whereas its 4 hour timeframe does not.
This would suggest that USO is more volatile than USOIL and, in fact, may actually be one of its leading indicators.
Let’s see how this plays out!
Next Action
- Continue to monitor the price action of USOIL, and USO, everyday.
UVXY

As can be seen within the chart above, the price of UVXY has again declined significantly, to the extent that I think it is now worth making a 1/3 entry (purple line with number one).
Nonetheless, factoring in that I may be wrong, I will look to make another entry at purple line number two if the price further declines to this level.
Let’s see how this plays out!
Next Action
- Continue monitoring the price action of UVXY everyday.
