Trading Journal
“First learn to trade then the money will follow!”
9.15am EST
Today, using the daily timeframe, I have to assess the following as soon as the markets open:
- Whether it will make sense to take full profits on my GLD gold trade.
- Whether it will be time to enter into another UNG trade.
- Whether I should take full profits in regard to my LLY trade.
- Look at my BAX trade to determine if I should add 1/6 to my current position.
- Look at my TLT trade to evaluate what will be my next course of action.
Watching Soloway’s video yesterday suggested that it is probably time to take full profits on GLD, and it may be time to enter a new UNG trade.
The last trade that I made regarding UNG, I made a small loss because the ETF gapped down. I will ensure that I don’t make the same mistake this time around by making sure I enter or exit a UNG ETF trade in good time.
LLY TRADE
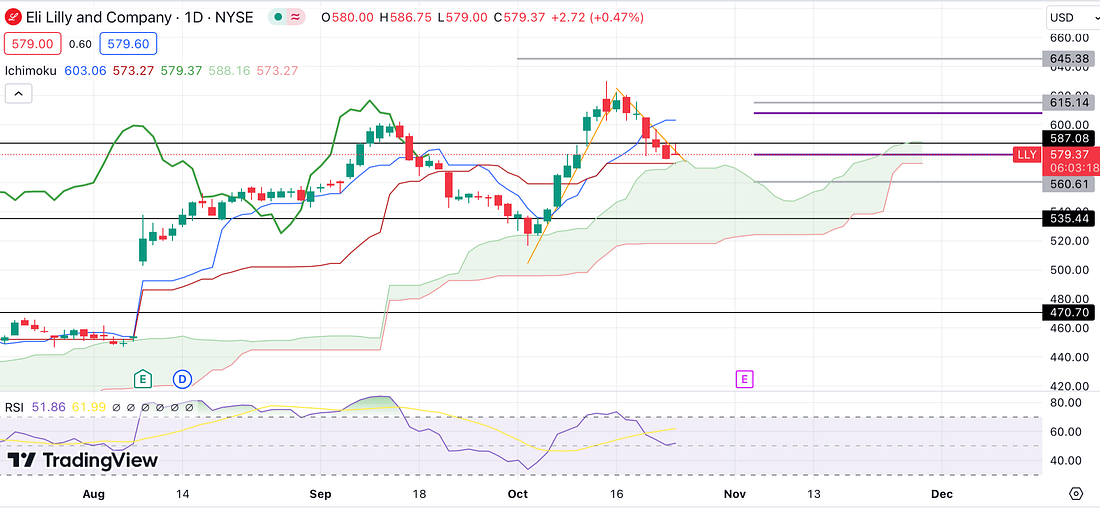
In regard to my LLY trade, I decided to move my stop-loss down to ensure that, at the least, I will be in profit regardless of what happens to the price action from now. This will be the first trade that I will assess today when the markets open.
It is also worth mentioning that this is the first trading journal entry that I have done directly onto my website without copy and paste-ing. I choose to do this in order to assess if it will be the best course of action in the future. It seems to, already, be having the affect of making want to complete my trading journal entries as soon as possible, as it enables me to, easily, see my progression.
As I expected, the price of LLY has jumped up on the opening. This is the reason why I choose to wait for the markets to open first before submitting my order, as the price has already started declining again.
Because LLY was only meant to be a swing trade, I have decided to take full profit from my short. As the price action seems to have declined on the daily timeframe to such an extent that I would naturally expect it to bounce back up at some point. When, exactly, the price will actually start to rally is besides the point. It makes sense to take this opportunity to further practice not being greedy.

The grey lines on the far right hand side show my initial (1) stop-loss, (2) entry level, and (3) take-profit area. The purple lines on the far right hand side show where I have move downwards my stop-loss and where I decided to take full profits.
Learning Point
- I should make my charts set-out clearer my stop loss, entry, and take profit levels.
- Monitoring or managing my trades everyday may require at least 1-2 hours of my time as soon as the markets open.
- In relation to swing trading, it may make sense to focus on the daily timeframe (as Soloway appears to do) when deciding entry, stop-loss, and exit levels.
- Completing my trading journal entry whilst analysing the charts at the same time appears to be the best approach.
GLD TRADE

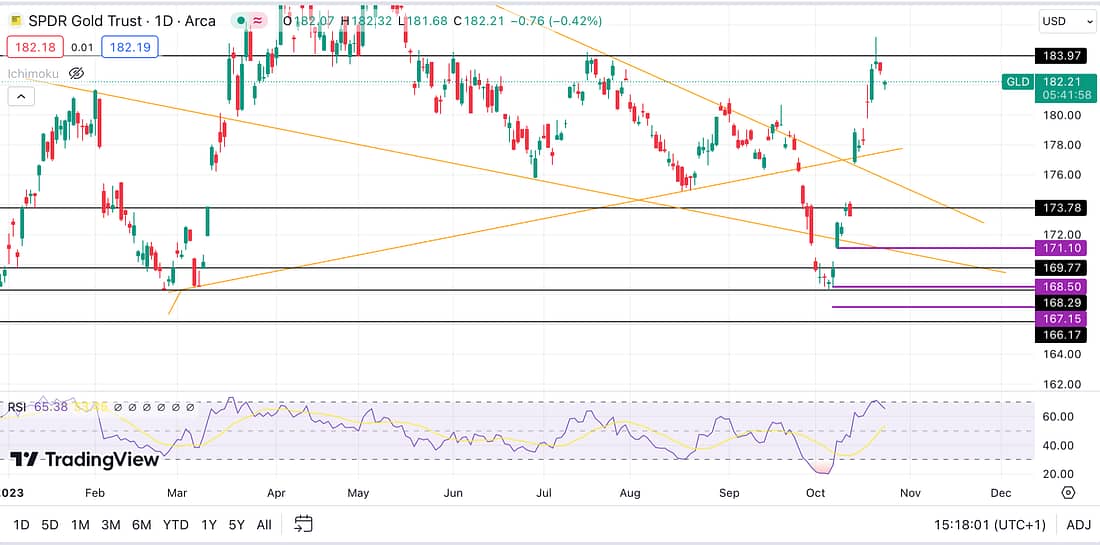
As can be seen above, the Gold price has rallied up tremendously on the daily timeframe from the second purple line (on the far right) where I made my entry. The first purple line at the bottom is where my stop-loss is placed, and the highest purple line is where I took 33% profit as the price made its way up.
As a result, I have just taken full profit on my remaining 66%. As I expect the Gold price to now decline back to the ‘scene of the crime’ on the daily timeframe after having such a tremendous run. This makes it highly likely that Gold (with a human personification) is now exhausted and needs a rest before she can run up again.
Therefore, I will look to make a re-entry at some point when the price has potentially pulled back to the trend line on the daily timeframe. Therefore, it is important that I continue to monitor the charts everyday in order to not miss the opportunity for a possible great re-entry.
Learning Point
- Without checking the charts everyday, it’s almost guaranteed that I will miss the right time to exit. As seen in the chart, the GLD gapped-down. So missing the exit yesterday meant that it was almost guaranteed that I would not be able to exit at the best price today.
- Using the daily timeframe seems too, definitely, be the best way to determine when to enter or exit a trade.
- I have got to make sure that I assess the charts in good time before the market closes in order to achieve the best exits and entries.
Next Action
- Improve how you mark-up the entry, stop-loss, and exit levels on your charts for readers of your trading journal (purple lines).
- Plan to use 90 minutes everyday to re-assess the trading charts and update your trading records.
- Use 90 minutes before the market closes to assess the charts to ensure great entry and exit levels.
- Use the daily timeframe to assess when to enter and exit a swing trade.
- Complete your trading journal entries directly on Involgize Capital’s website.
- Update trading spreadsheet with the latest profitable trades.
BTC TRADE
After watching Soloway’s latest trading video, I decided to enter a BTC trade in accordance with the daily timeframe. This is because BTC has pumped tremendously, making it likely that the price rally will not continue. Rather, I expect the price to decline back to the daily timeframe Tenkan (Ichimoku) due to exhaustion.
Nonetheless, because we are dealing with probabilities, I entered only 1/12 of my position ($0.88) just in case the price does not decline.
In order to carry out the trade, I found myself having to first purchase Bitcoin on the spot market. Then work out, using the tradingview ruler, what the percentage move would be to trigger my stop-loss (5%), to then in-turn work out what would be 5% of my capital at risk.
Initially, I considered using Kucoin’s derivative trading platform to put on the trade, but due to its minimum requirement amount, I decided to use their spot trading platform instead.
When looking at the 4 hour timeframe, however, I form the view that BTC’s price will further rally. But, in contrast, the daily timeframe creates the impression of the price being greatly over-extended.
Therefore, I’m taking an experimental mindset to this trade to see how effective the daily timeframe is when anticipating price declines or reversals.

As shown above, the purple line number 1 is my entry, the purple line number 2 is my stop-loss, and the purple line number 3 is my take profit level. All in all, this trade should offer, at the least, a highly probable 1:1, in accordance with the daily timeframe.
MANA TRADE
After looking on coinmarketcap.com for the cryptos that have been trending, I decided to trade MANA following the same logic as my BTC trade (above):
BTC dominance is increasing. This is expected to have an adverse effect on the price of Altcoins such as MANA.
MANA has experienced a great price pump along side BTC, which as of yet, has not declined greatly. Therefore, this may provide a great high probability trading opportunity. Thus I’ve entered a 1/6 trade ($1.6) in accordance with the daily timeframe, and will seek to add further 1/6 positions if the price increases further. Purple line number 1 is my entry. Purple line number 2 is my stop-loss, and purple line number 3 is my take-profit level. This is essence is a high probability 1:1 / 2:1 risk to reward trade.

Next Action
- Update trading spreadsheet with latest trades.
- Create a watchlist of financial markets to analyse everyday.
- Assess the charts before the markets open tomorrow.
IVG (Involgize)