US10Y

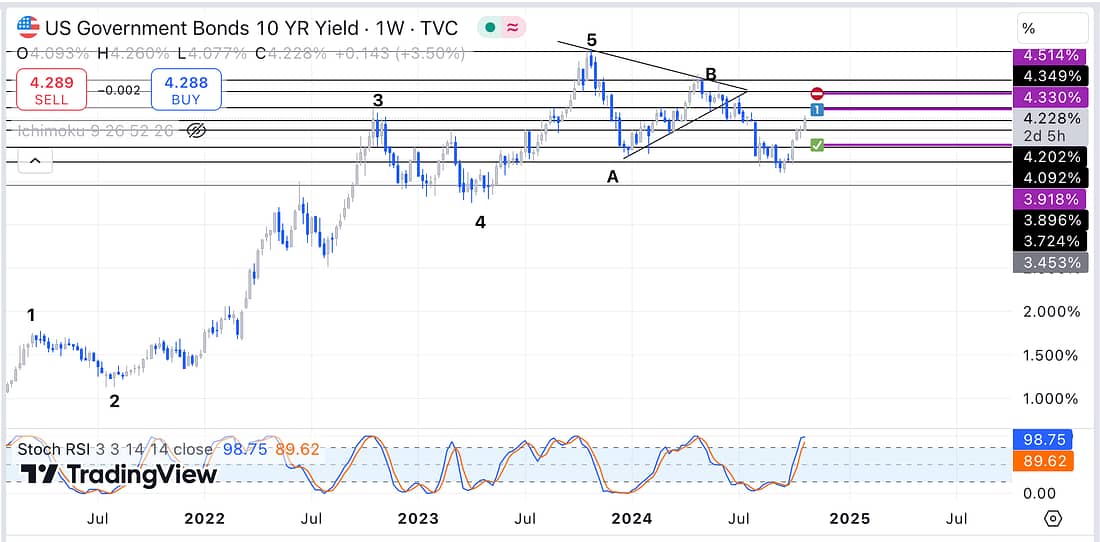
As can be seen above, the US10Y has risen sharply over the last 5 weeks or so on the weekly timeframe.
Price Action Technical Analysis coupled with the weekly Stochastic RSI would suggest that probabilities now favours the price action reversing at some point. The only question is whether it will reverse at the current resistance level, or the next resistance levels.
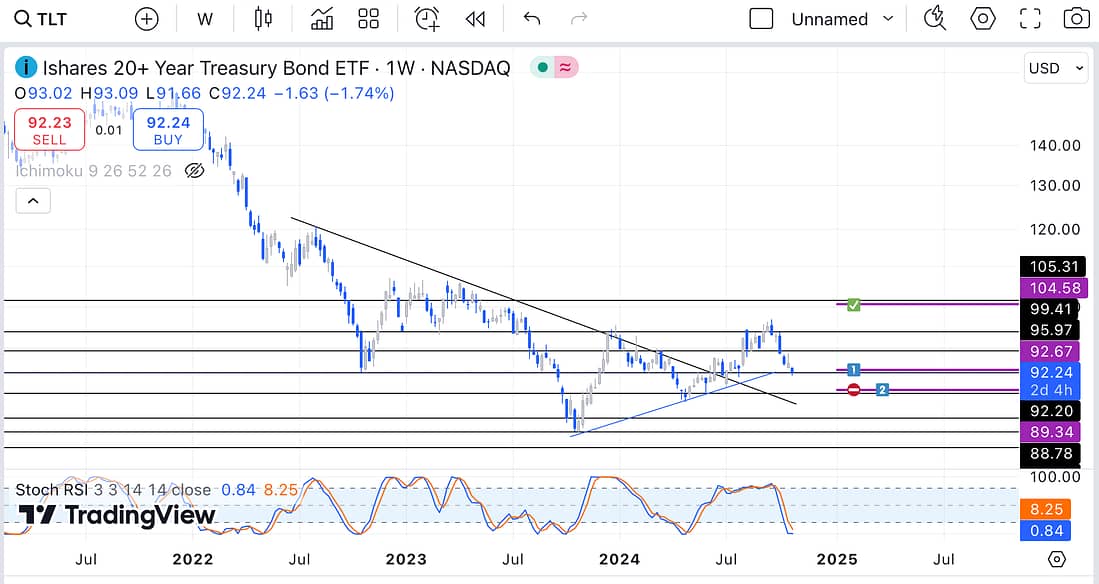
As a result, I have decided to submit a 1/3 long entry using the TLT (the TLT has an inverse inter-market relationships with the US 10 Year Bond. In other words, when the US10Y goes down, the TLT goes up):
TLT

Learning Points
- Trading the weekly timeframe requires me to be far more patience as the trades will require weeks to play out.
- I have made significant progress (come a long way) in relation to my ability to profitably trade the TLT, and the US stock market in general. As, several months back, I remember my feelings of temporary defeat as I had to acknowledge how much I lacked sufficient experience and success trading US stocks in comparison to trading crypto.
- The upside of weekly timeframe trading is the following…
- (1) there is more certainty concerning the movement of the price action…
- (2) I can be 10x more flexible with my actual entry prices…
- (3) I can afford to miss a few days without going through my entire 25+ trading chart watchlist… and
- (4) I can run 10+ trades all at the same time relatively easily.
- Trading in accordance to the weekly timeframe will now make it viable for me to learn more about how to incorporate options trading into my overall trading strategy.
Next Action
- Continue to monitor the price action of the US10Y and TLT on a daily basis.
- Continue to go through your trading chart watchlist to spot any further weekly timeframe trading opportunities.
- Read your latest trading book to continue your advanced trading learning development.
- Continue to learn from professional swings traders by watching their daily trading videos.
