Trading Journal
“First learn to trade then the money will follow!”
USO / USOIL – CLOSED TRADE

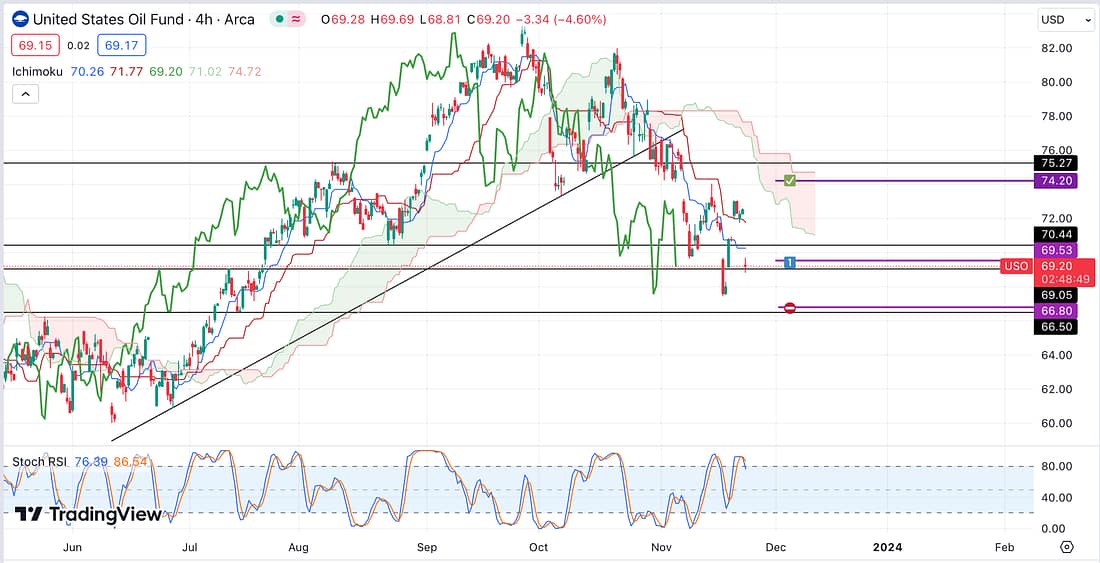
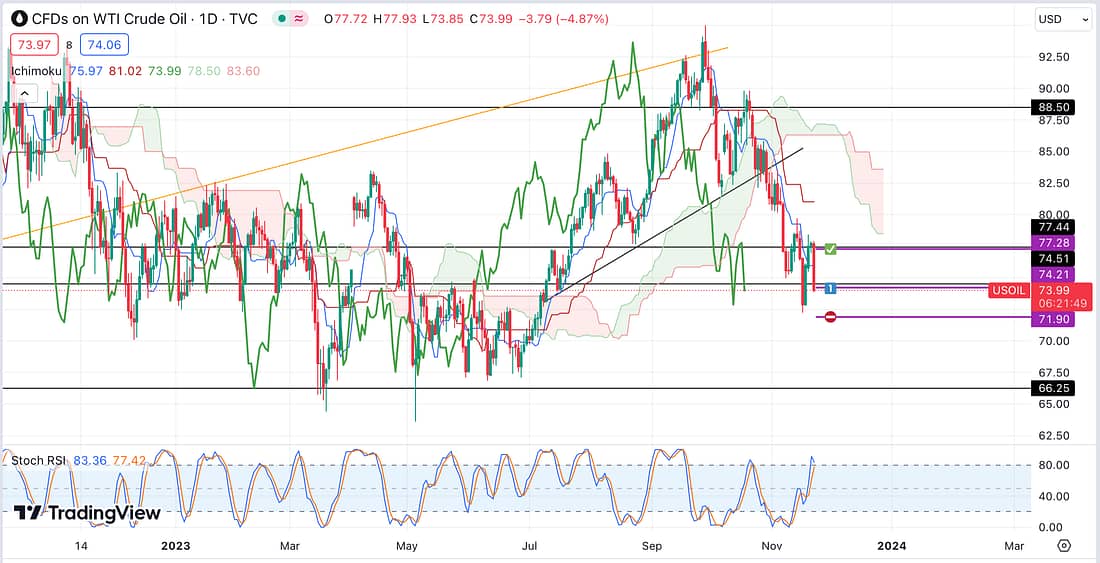
Today, the oil price collapse on the daily timeframe. There must have been some sort of OPEC meeting or something.
The result is that the USO ETF’s price declined dramatically also, hitting my newly moved stop-loss.
The upside: overall, the trade was closed with me in profit.
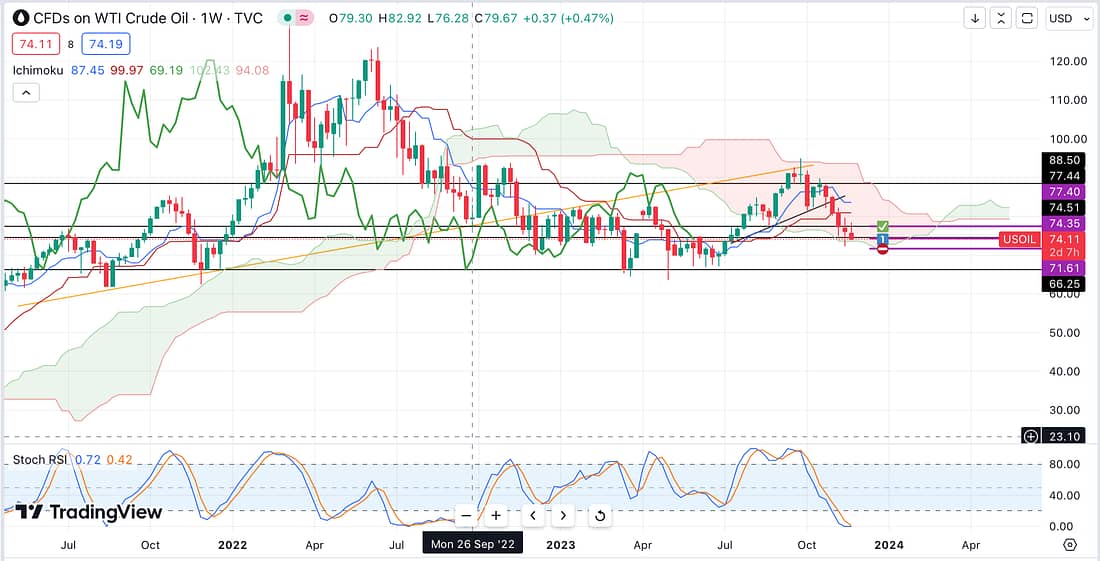
The downside: it appears that the oil price may still be set to rise due to the weekly timeframe. Therefore, the triggering of my stop-loss has taken me out of the oil market prematurely.
Learning Point
- Use the weekly timeframe to determine where to place your stop-loss so that you remove the possibility of being stopped out in line with the daily timeframe.
- When considering placing a trade, continue to cycle through the timeframes from the weekly, to the daily, to the 4 hour to get a sense of what is happening overall with the price action. Remember that the 4 hour may provide us with an early signal, but it’s the weekly that tells us if, overall, the price direction has just started; is in progress, or is coming to an end.
- The daily timeframe informs us about the most likely moves between the current support and resistance lines or levels. Therefore, the daily timeframe seems best suited for short-term swing trades. I knew this before but, now, I just have a stronger appreciation (coupled with experience of different markets) for how significant it is in this regard.
- Writing this journal is enabling me to, effectively, learn how to trade profitably at a supernatural pace.
USOIL – REENTRY


As can be seen by the three different timeframes above, the price of USOIL appears to now be starting to rebound.
Learning Point
- If we look at the daily timeframe, we can see that there is a huge gap or white space between the price action and the Kumo Cloud. Looking at all of the three charts together revealed to me that this distance seems to occur when the price has started to move sideways. In support, when the price action is experiencing a strong decline this is typically accompanied by the candlesticks being relatively close to the Kumo Cloud at a sharp angle (for example, see DISH’s weekly timeframe chart below).
- Entering 1/10 of my trading capital on a trade would seem to imply that there is the possibility of the price declining about 9 to 10 times; therefore, it makes sense to spread out my entry. However, if I expect the price to decline or rally 3 to 5 times from its current level, then it may make strategic sense to make sure that I enter at least 1/3 or 1/5 of my risk capital if I intend on maximising my trading profitability.
Next Action
- Monitor USOIL / USO trade tomorrow in terms of the price action’s relationship to current resistance and support levels on the daily and weekly timeframes.
DISH

Today, I entered a long trade in regard to DISH.
Learning Point
- Around 2/3 of my risk capital was the minimum amount that I could use to set my stop-loss concerning my entry. I was happy to still enter the trade in spite of the uncertainty, because the next support level below is the all time low. Therefore, as long as I can make another 1/3 entry at that level if the price further declines (which I can), then this will justifies my previous 2/3 entry.
Next Action
- Monitor DISH trade tomorrow to consider the relationship between the latest price action and the support and resistance levels on the daily and weekly timeframes.
IVG (Involgize)