Trading Journal
“First learn to trade then the money will follow!”
DISH

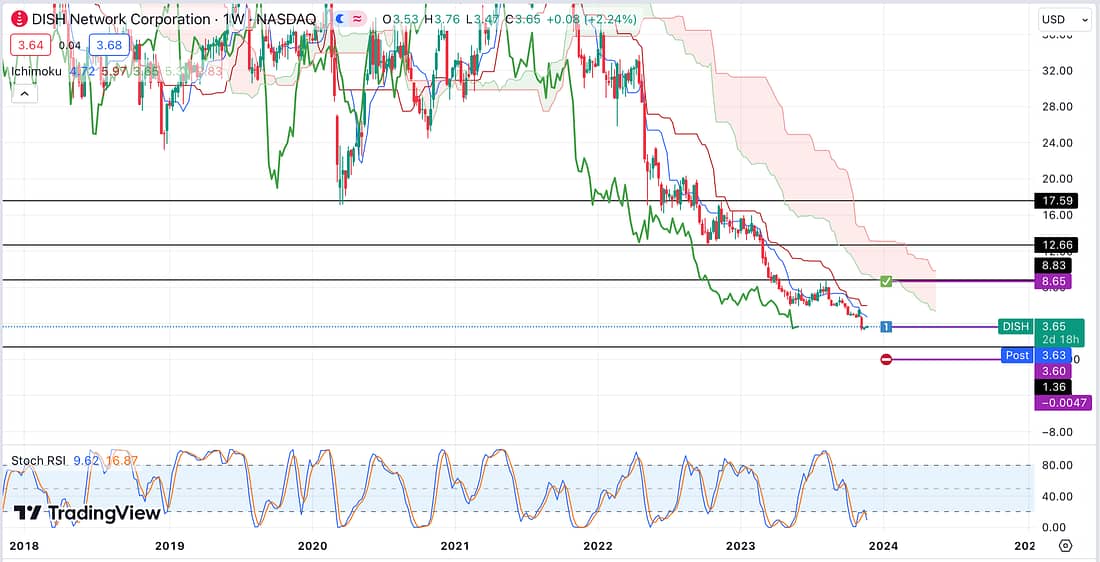
After watching Soloway’s latest YouTube trading video, I decided to assess DISH then subsequently prepare a long trade. As shown above, my entry is purple line numbered 1, my stop-loss is the purple line with the red no-entry sign, and my expected take profit level is the purple line with the green box.
Backtesting the company’s share price revealed that after declines, the price tends to rebound strongly.
In light of this, it makes perfect strategic sense to enter at least a 1/10 position.
However, if the price continues to decline further it will hit its all time low (back to the lowest levels when the shares appear to have first entered the Nasdaq). Therefore, I am going to initially enter at 1/3 the position. And add another 1/3 if the price further falls.
From my recent experience, trading these types of trading setup, I expect this trade to require about two to three weeks to play out.
Let’s see what happens.
Next Action
- Soon as the market re-opens tomorrow, put in an 1/3 order to go long DISH.
USO

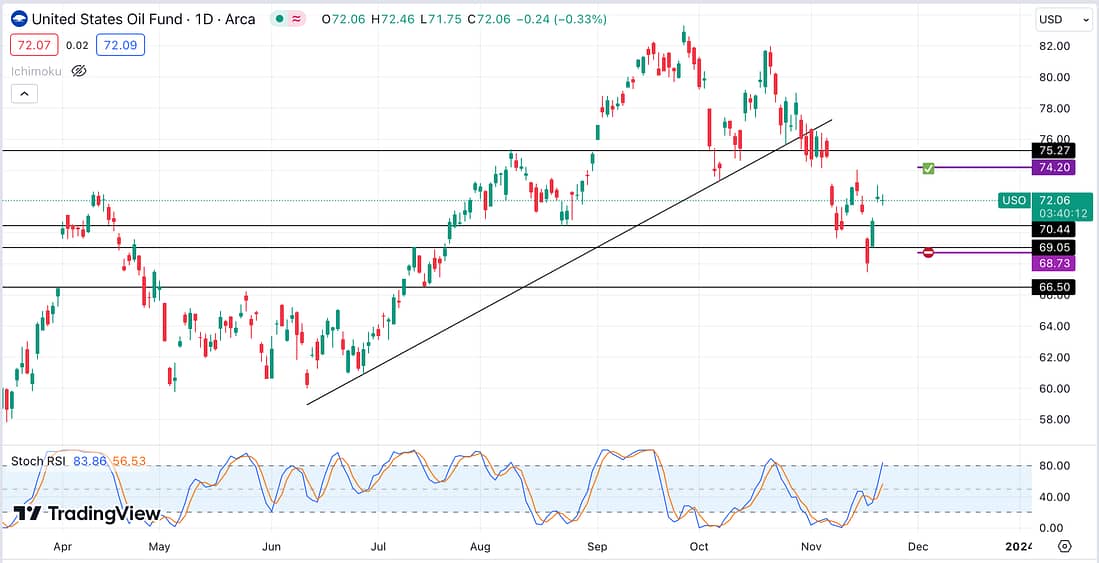
Today, I was required to move up my stop-loss in relation to my USOIL ETF trade (USO), as can be seen above. It looks like the price will continue to rise for the next two days at the least.
Next Action
- Analyse USOIL’s daily and weekly timeframe chart tomorrow to determine what should be the next course of action concerning this trade. (1) Does the weekly stochastic RSI suggest that the price is likely to still rise this week? (2) If yes, what does the daily timeframe reveal about the price action, such as will there be an expected pull back first? (3) Where are the major resistance lines on the weekly timeframe that would likely cause the price to stop rising or to reverse? (4)
TLT / US10 YEAR YIELD

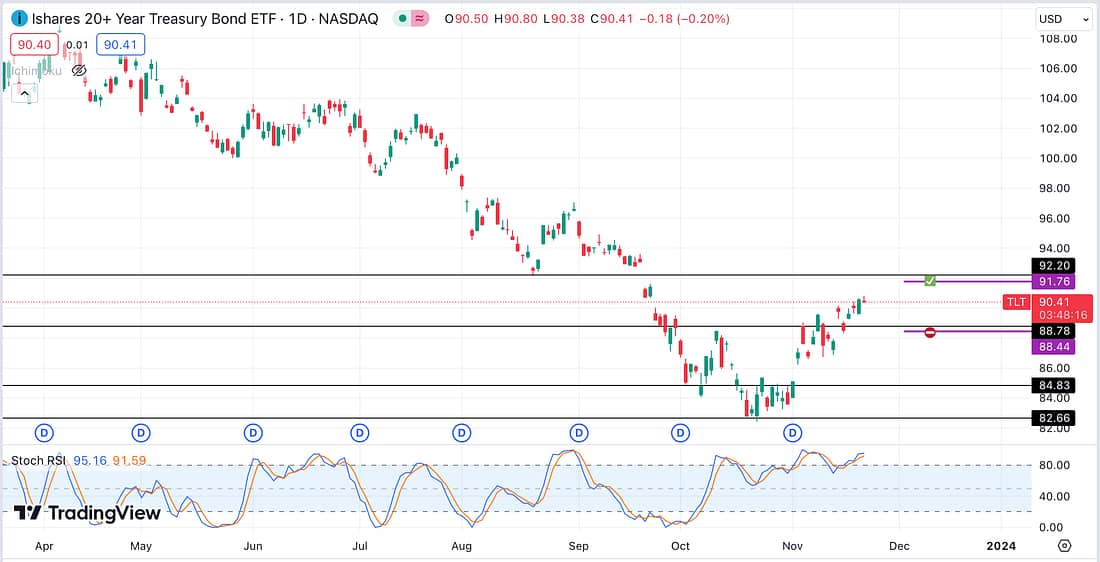
Today, I decided to move up my stop-loss (the purple line with the red no entry sign) because the US10 Year Yield seems almost due to start rising again or move sideways after it’s currently decline on the weekly.

As shown above, the odds are against it continuing to decline because it has almost hit a major support level on the weekly timeframe, and the weekly stochastic RSI is in the oversold position. In addition, the weekly Kumo Cloud is still bullish (green), the price has not crossed the Kijun, and the lagging span is free and clear to rise (not entangled in the price action).
Next Action
- Analyse the weekly and daily timeframe to determine whether the stop-loss level should be moved up further, or if it makes strategic sense to take full profits in light of any relevant support level on the US10 Year Yield.
IVG (Involgize)