Trading Watchlist:
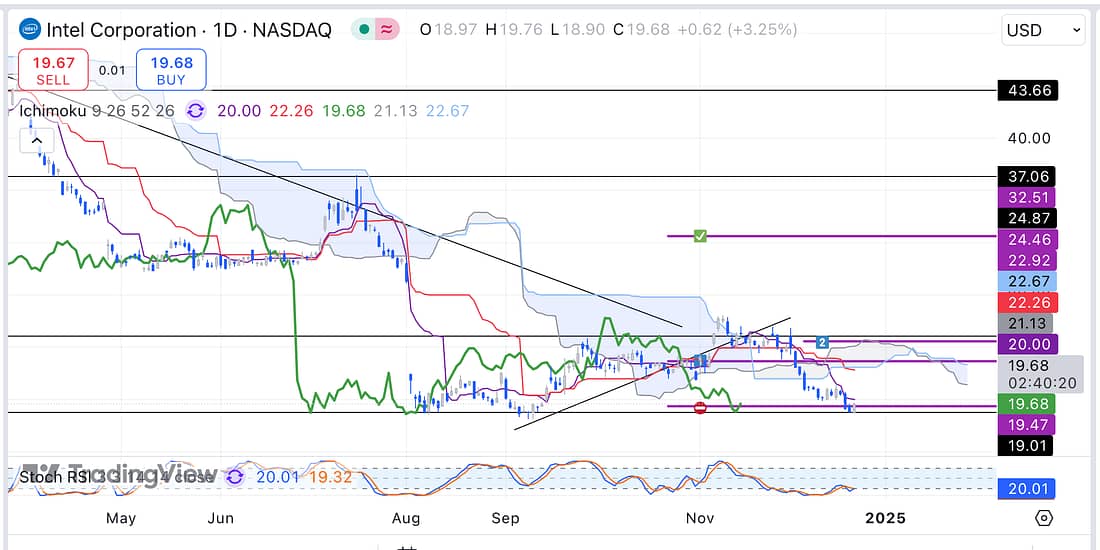
1. INTC – analysed:

2. DG – analysed.
3. X – analysed.
4. CMG – analysed: wait patiently to see if the price action rally’s back to the Tenkan before making an entry.
5. FDX – analysed: decline strongly. Continue to monitor everyday to keep up your chart analysis learning process.
6. SOXX – “where SOXX goes, the rest of the market follows”: still ranging sideways.
7. PALL – continues to slowly but surely grind downwards out of no man’s land.
8. MARA – it was a brilliant decision to exit the MARA trade as soon as possible. The small lost that I sustain by adding additional capital in regard to the trade taught me two main things: (1) it is more risky to add capital when the multiple entries are relatively close together, or not too far apart… (2) taking into account what the broader market is highly likely to do in the proceeding weeks, in terms of its weekly chart pattern, it crucial for being in the right position concerning high-probability trades.
9. BTC – analysed.
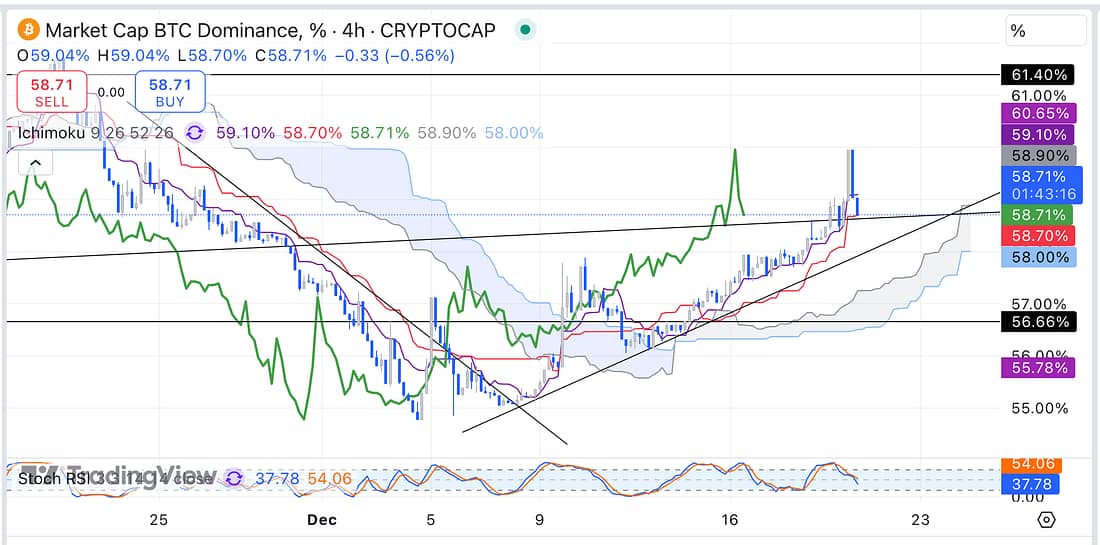
10. BTC.D – analysed. It looks like BTC.D is set to continue rallying this weekend in accordance with the 4 hour timeframe, after a strong sell-off:

That said, the broader market still looks like it will continue its overall decline, and if it does, this will take BTC down with it for sure.
11. SFM – analysed: SFM is declining nicely as I had anticipated and as I have been waiting to occur for many, many months.
12. JETS – seems to be hanging on to its bullish price action structure on the 4 hour timeframe. However, the daily timeframe indicates that probabilities now favours the price action, eventually, decline to the next major support level below (unless it breaks through the daily timeframe resistance level above).
13. UAL – analysed: continue to trade this stock in accordance to the weekly timeframe.
14. COST – analysed.
15. WMT – analsyed: using (1) the weekly timeframe Stochastic RSI along side… (2) the resistance or support level line, and… (3) the daily timeframe… enables me to scale into the trade with an early high-probability entry.
16. AXP – analysed.
17. RUT – analysed: broader market is declining.
18. AMD – analysed: declined hard.
19. MU – analysed: declined hard.
20. TIGR – analysed.
21. BIDU – analysed.
22. US10Y – analysed: yields are increasing, slowly but surely, meaning the price of the US10 must be declining?
23. US10 – price of US10 declining as to be expected (intermarket relationship).
24. TLT – analysed.
25. XAUUSD – analysed: buy gold if the price drops down to the next major support level on the daily timeframe:

Learning Points
- Irrespective of the timeframe of the trades that I currently have running, it is important to continue to analyse the charts everyday to keep up the price action analysis learning process, and be able to spot new trading opportunities. Therefore, remaining emotional detached, at all times, is a prerequisite and of primary importance.
- I now appreciate that learning how to read the price action movement in relation to the daily timeframe was critical. This is becuase it enables me to submit high probability early entries without needing to wait for the lagging span on the 4 hour timeframe to cross the diagonal trendline. In fact, the lagging span may now act as a great indicator to know when to add additional capital to the relevant trade.
- Using (1) the weekly timeframe Stochastic RSI along side… (2) the resistance or support level line, and… (3) the daily timeframe… enables me to scale into the trade with an early high-probability entry.
Next Actions
- Continue to use the 4 hour timeframe lagging span and trendlines in conjunction with the daily timeframe’s major support and resistance levels to assess the most likely direction of the price action.
- Continue to use… (1) the weekly timeframe Stochastic RSI… (2) the resistance and support level lines… and (3) the daily timeframe to ascertain and scale into high-probability trades early.
- Update new trading spreadsheet with latest winning and losing trades.
