Trading Journal
“First learn to trade then the money will follow!”
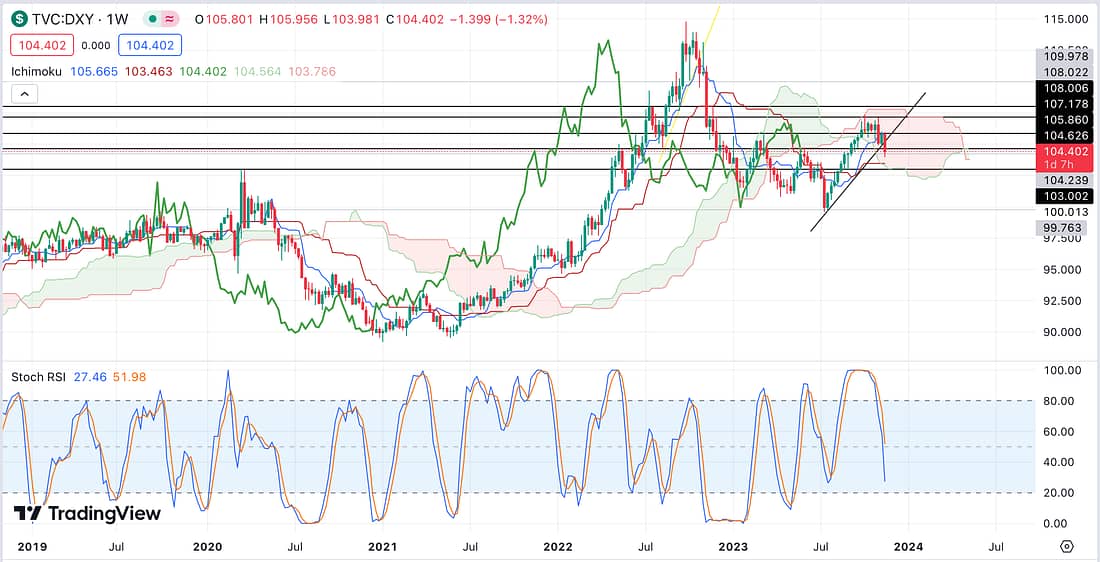
DXY

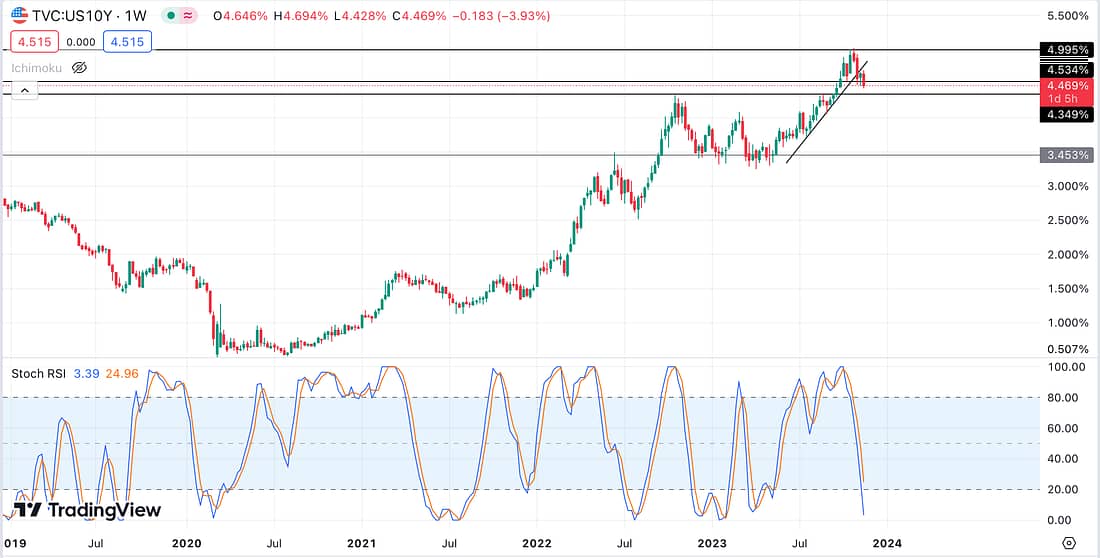
US10 YEAR YIELD

I have several trades that are highly correlated, all requiring the overall stock market to be declining in order to be in profit (SPY, AAPL, MSFT, TQQQ, NVDA, AMZN).
Unfortunately, all of these trades are currently trading at a loss, which is contrary to my expectations when I entered them on their daily timeframes.
Therefore, I decided to re-assess the DXY and US10 Year Yield in order to make sense of what may be happening on a macro level, carrying out inter-market analysis.
What I seem to have re-acknowledged is that when the weekly Stochastic RSI is heading towards the oversold position, then the price action is likely to decline.
This is because the weekly bullish or bearish price direction is stronger than the 4 hour and the daily timeframes as to be expected.
As can be seen on the charts above, the weekly price action of the DXY & US10 Year is currently bearish. This means that there is a strong likelihood that the price of the DXY & US10 Year will makes their way to the next support levels.
In support of this proposition, we can see that the Stochastic RSI is making its way to the oversold position. Until this chart pattern changes, it is to be expected that the stock market, in general, will continue to rise today; tomorrow; and into next week.
As a result of the above, I decided to close all of my outstanding short trades, which are all correlated with the stock market, at a loss.
Learning Point
- Make sure that when putting on any trade, especially those that are highly correlated, that you assess their inter-market relationships. And that you, first, rely heavily on assessing their weekly timeframes, as oppose to their dailies, to determine the most probably price action direction.
- The daily timeframes of the DXY and the US10 Year Yield do not provide enough information in regard to the bearish or bullish overall direction of these assets. Therefore, it will be key to look at their weekly timeframes to better predict their price direction.
- If I had previously relied on the weekly timeframes before carrying out my correlated trades, I would have gone long instead of submitting short trade orders. This would have resulted in me achieving numerous in-profit trades.
Next Action
- Check the DXY and the US10 Year Yield chart everyday to see when the weekly Stochastic RSI goes flat or is ready to turn up from its oversold position.
- Favour trades that move in the opposite direction to a bearish DXY and US10 Year Yield.
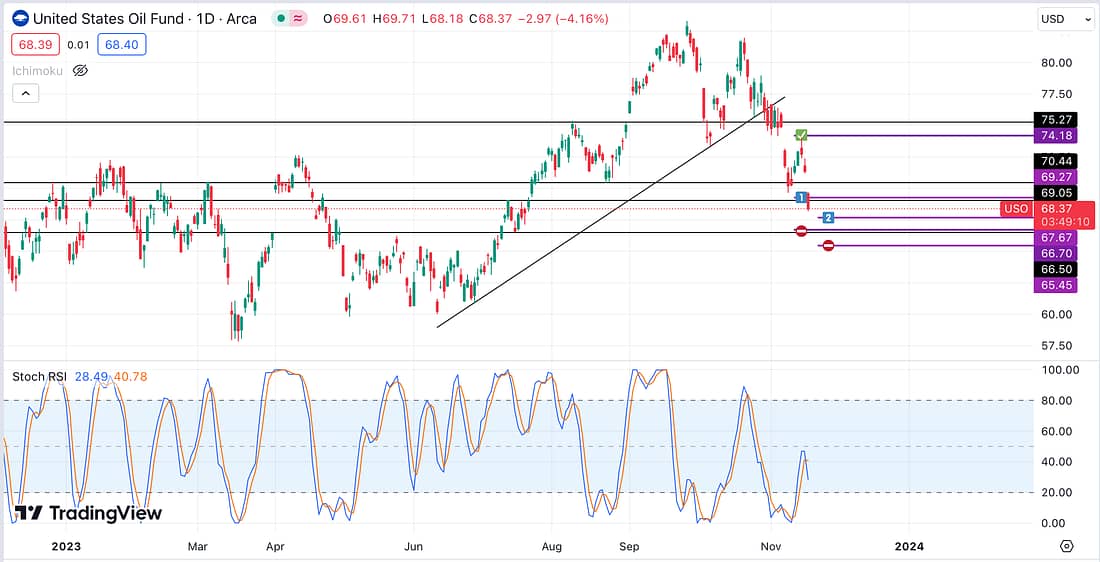
USO

I decided to enter a long trade in relation to USO (USOIL) as there has recently been a strong sell-off, and it has been hitting key support levels.
In spite of this, I entered with a 1/10 position size (purple lines number 1 and 2) and with short distance stop-losses (purple lines with no entry signs). This is because of the uncertainty as to whether the price will, actually, rebound.
Next Action
- Check the direction of the Stochastic RSI of USO and USOIL on their weekly timeframes.

As can be seen above the Stochastic RSI of USOIL on the weekly timeframe is still moving downwards in harmony with the direction of the DXY and the US10 Year Yield.
Learning Point
- This would suggest that the best time to enter a long position would be when the weekly Stochastic RSI of the DXY and the US10 Year starts to turn upwards.
BTC

QQQ

As can be seen above, the weekly Stochastic RSI on BTC and the NASDAQ appears to move in the same direction, which is currently upwards.
However, BTC price action appears to be leading the QQQ and the stock market in general. This would suggest that the stock market’s price rise will come to a holt at some point as has Bitcoin’s.
If BTC starts to decline on the weekly timeframe, then we would expect that the stock market will follow suit. However, this is likely to occur, only, when the DXY and the US10 Year start to rise (which is highly probable a week or so away from now).
Let’s see how this plays out!
IVG (Involgize)