Trading Watchlist:
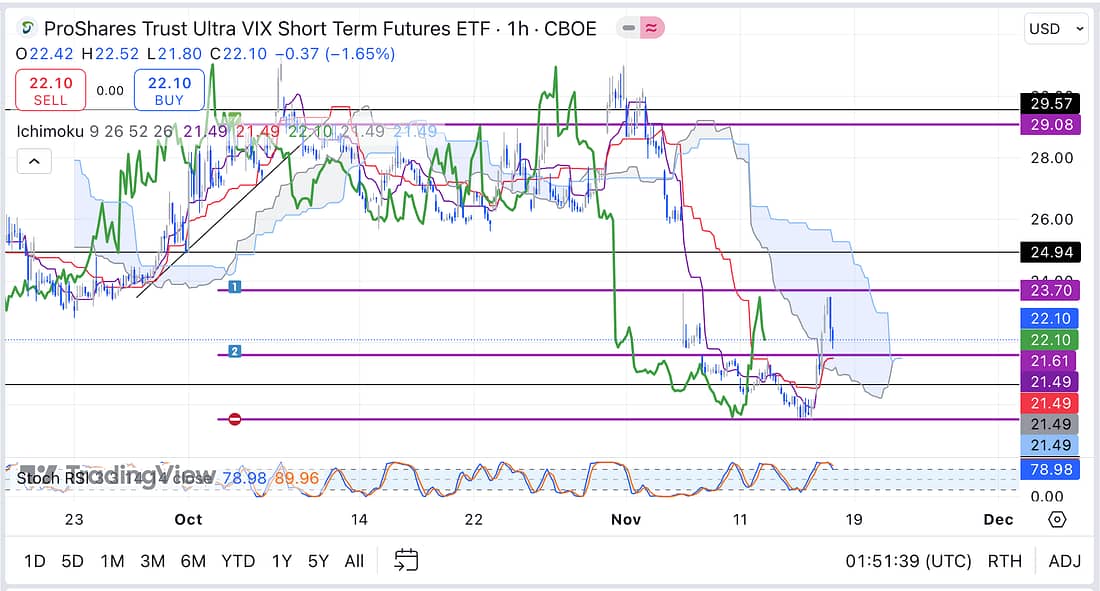
1. UVXY – the UVXY appears to have triggered my stop-loss level, then immediately rallied back up to the level of my second entry. This would suggest that it was some sort of foreseeable stop-loss hunt. Yes, it triggered my stop-loss:

2. DXY – the price action of the DXY on the 4 hour timeframe still seems very strong even after its surprise rapid and sustained recent rise.
3. US10Y – it appears that the US10Y is acting as a leading indicator in relation to what the DXY will do next. Currently, the US10Y is showing weakness on the 4 hour timeframe. As soon as the price action candles close below the Kumo Cloud then that will most likely be time to short the US10Y. And this may also further indicate that the DXY will likewise decline in due course.
4. RUT – experienced a strong pull-back after its bullish rise last week.
5. SPY – now showing a weakening of the bullish price action pattern.
6. QQQ – showing the same price action pattern and weakening bullish strength as the SPY.
7. PALL – analysed.
8. BIDU – analysed.
9. FDX – analysed.
10. JETS – incredibly, JETS is still rising strongly on the 4 hour timeframe.
11. UAL – analysed.
12. SFM – analysed.
13. COST – analysed.
14. AXP – analysed.
15. WBA – analysed.
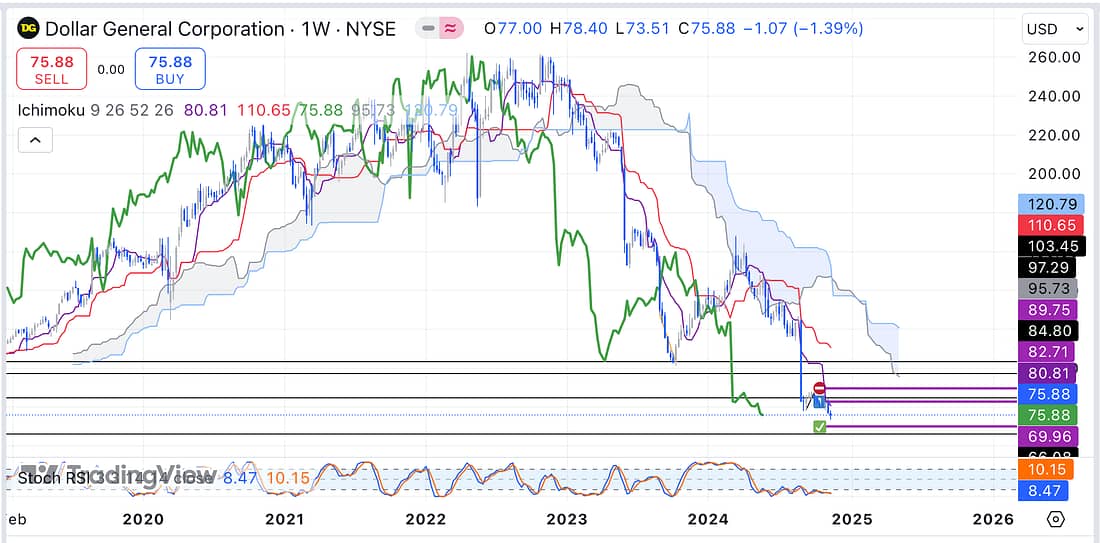
16. DG – get out of DG short trade as soon as possible because it looks due for a strong bounce (at the least) on the weekly timeframe:

17. MU – MU appears to have broken it bullish price action structure in light of the fact that the SOXX now also appears to be ranging:

Therefore, I will exit the long trade, as soon as possible, when the markets re-open on Monday.
18. SOXX – analysed.
19. CMG – analysed.
20. X – analysed.
21. TIGR – analysed.
22. LIT – analysed.
23. INTC – analysed.
24. NATGAS – analysed.
25. USOIL – analysed.
26. XAUUSD – analysed.
Learning Points
- Stop-loss hunts are also being carried out on the UVXY even though it is just supposed to be an ETF that mimics the VIX. Therefore, in the future, be extra cautious or avoid predictable price levels when trading this financial instrument.
- Re-appreciated the importance of using the Ichimoku on the 4 hour timeframe to assess the most probable direction of the weekly timeframe. In particular, if the price action candle of LIT closed below the Kumo Cloud on the 4 hour, I would now be looking to short the stock.
- Important to continue analysing the charts specifically in writing in order to deepen my learning process, stay up to date, and keep a sufficiently detailed and accurate record.
- The trading watchlist analysis may now need to be carried out over the course of two days, as opposed to one, due to it growing length. The first day will prioritise active financial stock and instruments, and the second day will focus on tracking the price action of different markets for trading opportunities on the weekly timeframe. Having said this, let us see how my approach actually needs to evolve so that it can be most effective.
Next Actions
- Record latest UVXY losses on the new trading spreadsheet.
- Get out of DG short as soon as possible on Monday when the markets re-open.
- Exit MU long as soon as possible on Monday as the SOXX is ranging.
