Trading Watchlist:
1. SPY – The broader market is still climbing.
2. RUT – The Russell 2000 (stock market companies minus the technology stock) is still climbing.
3. BTC – Bitcoin is rallying in correlation with the US stock market as to be expected.
4. DXY – Interesting that the US dollar seems to be rising along side the broader stock market as they tend to have an inverse relationship. Therefore, I will wait patiently for the lagging span to breakthrough the diagonal trendline on the 4 hour timeframe before considering entering a short in accordance with the US dollar’s weekly timeframe.
5. XAUUSD – As to be expected, Gold is declining strongly in light of the continued price rise of the US dollar.
6. US10Y – Appears to have started pulling back, but the lagging span on the 4 hour timeframe has not broken through its diagonal trendline. It seems that the US10Y may also be a leading indicator for the direction of the DXY. Continue to monitor, everyday, what happens with the price action movement of the US10Y and the DXY. The expectation is that they will continue to move in tandem.
7. USOIL – Still ranging on the weekly timeframe so stay out of it (do not trade).
8. NATGAS – Appears to be potentially breaking out to the upside, so continue to monitor everyday for a potential long trade.
9. DG – Continue to monitor DG everyday as there appears to be a good pull-back forming on the 4 hour timeframe that will allow more capital to be added to the weekly timeframe trade.
10. INTC – See below:
11. MU – I am surprised that the price action has now fallen just below my original entry level, hitting support. Let’s see if it can hold the support level, but if it cannot, then I will exit this trade as soon as possible.
12. FDX – Continuing to rise as expected.
13. BIDU
14. JETS – Continuing to rise strongly on the 4 hour timeframe, highlighting the importance of using a reliable confirmation signal (like the lagging span) before going short.
15. UAL – As per above so deciding to close my short trades relating to SFM, JETS, COST, AXP, and UAL (which all show similar chart patterns) was crucial.
16. AXP
17. PALL – Still showing strong selling pressure on the weekly timeframe with the daily and 4 hour Stochastic RSI both flatlined. I must make sure that I continue to analyse this chart everyday as it is likely to present a really good trading opportunity in the near future.
18. LIT
19. WBA
20. COST
21. SFM
22. X – Interesting to see that the price action seems to be still ranging on the weekly timeframe, which I take as a clear sign that it is best to stay away (do not trade).
23. TIGR – Intriguingly, Chinese stock that rallied real hard about 6 weeks ago all now seem to be returning back to their previous levels.
24. CMG – Been keeping a close eye on CMG’s price action as it climbs steadily back to the previous high prices it experienced before its latest steep decline. I shorted this stock successfully about three months ago so I will revisit my notes to see what I did exactly.
Learning Point
I have felt the psychological disadvantage of not journaling on a daily basis because I have not carried out any trades for the last two weeks or so.
So my main learning point is that there is no reason to restrict my trading journal posts to discussing only actual trades.
As it is still necessary (for me) to analyse the charts every day or so, and I would benefit tremendously if I use my trading journal to assist me with this process.
Now, it is just a case of establishing the most efficient and effective way to do this.
CMG – Revisiting my journal notes on CMG, I saw that I successfully shorted the stock using the Ichimoku cloud and lagging span. When the price action candle closed below the Kumo Cloud on the 4 hour timeframe, I took that as an early signal to scale into a short position. The lagging span had not yet broken through the diagonal trendline, but was very closed to doing so. In light of this, I am now taking the correct approach to wait for the following stock to show the same pattern before entering some possible shorts: UAL, JETS, SFM, COST, and AXP. This time though, the challenge will be to practice adding additional capital to the trade as they start to decline. On the other hand, I could also use this method to long these stock right now, however, I am mindful of the risk that this would impose on my capital (the risk to return is probably not worth it at this current stage).
UVXY

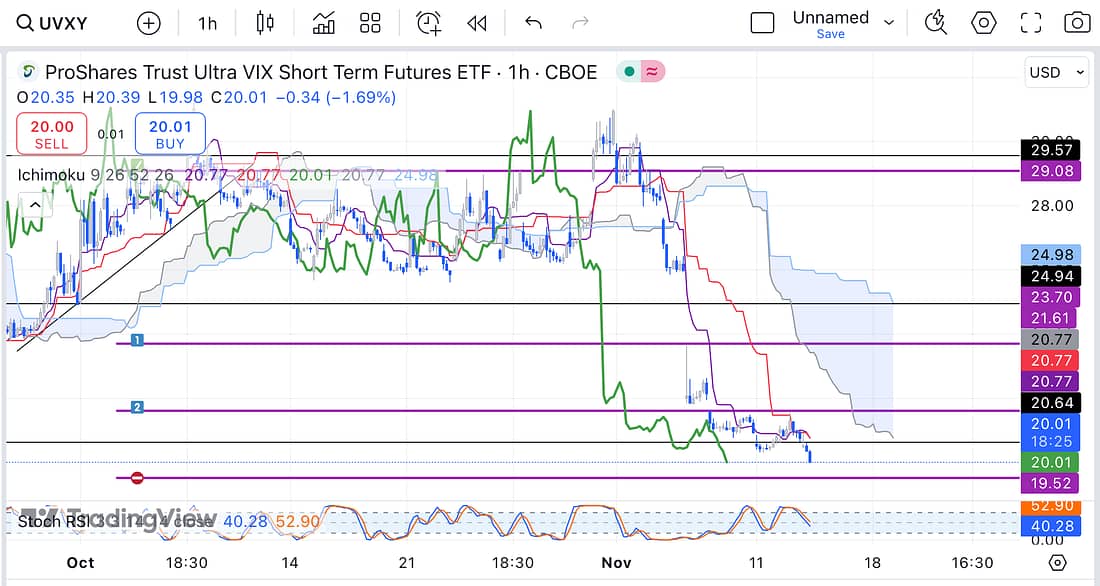
To my surprise, UVXY continues to decline (past strong support levels) as the US stock market experiences a strong rally.
Therefore, this seems to have taught me that the UVXY moves inversely to the US stock market, in the respect that, when there are strong declines, the UVXY rises strongly. But when the US stock market rises strongly, the UVXY declines greatly.
Next Action
Continue to monitor the price action of the UVXY everyday (as you have been doing) to keep up your learning process.
INTC

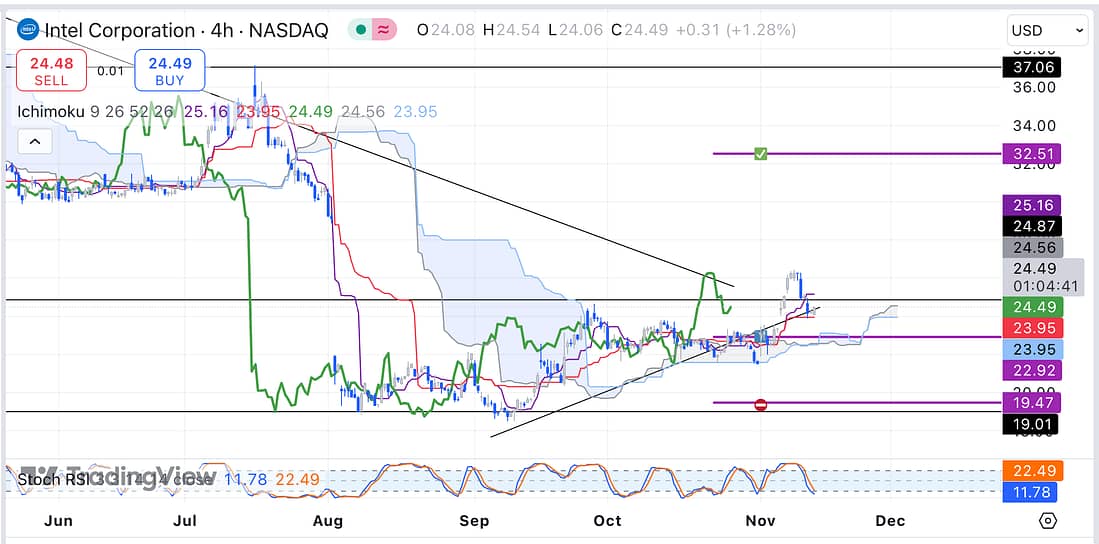
As can be seen above, it appears to be the right time to add additional capital to INTC trade on the 4 hour timeframe as the price action appears to still be bullish after a good pullback to the Ichimoku Kiljun.

Next Action
- Add 50% of the original capital used for the initial entry.
- Continue to monitor the price action of INTC everyday to continue to learning process.
