Trading Journal
“First learn to trade then the money will follow!”
Today, trading watchlist:
Monitoring of Current Trades
- GLD / XAUUSD
- TQQQ / QQQ
- LUV
- TLT
- AAPL
- NVDA
- BTC
- SPY
- AMZN
- USO / USOIL
- SOUTHERN COPPER CORP
Assessment of Overall Market
- DXY
- US10 Year Yield
- LTCN
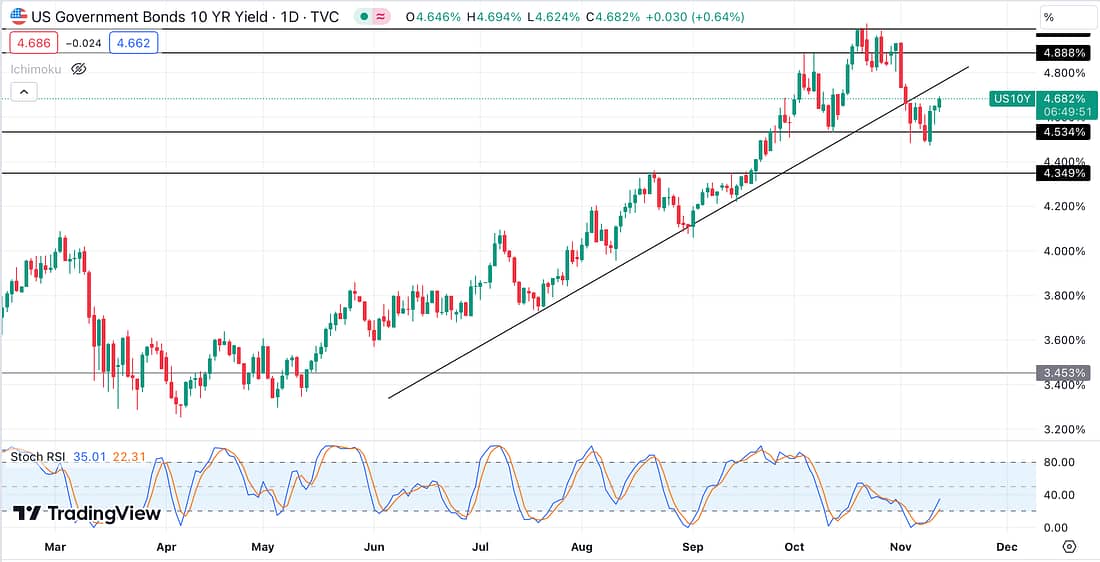
US10 Year Yield

When yields are rising this puts pressure on the US Stock Market to go down. Likewise, when yields go down then the stock market will tend to go up.
In light of the daily timeframe chart, I’m expecting yields to go up for the next day or so, especially as the Stochastic RSI is making its way to the overbought position.
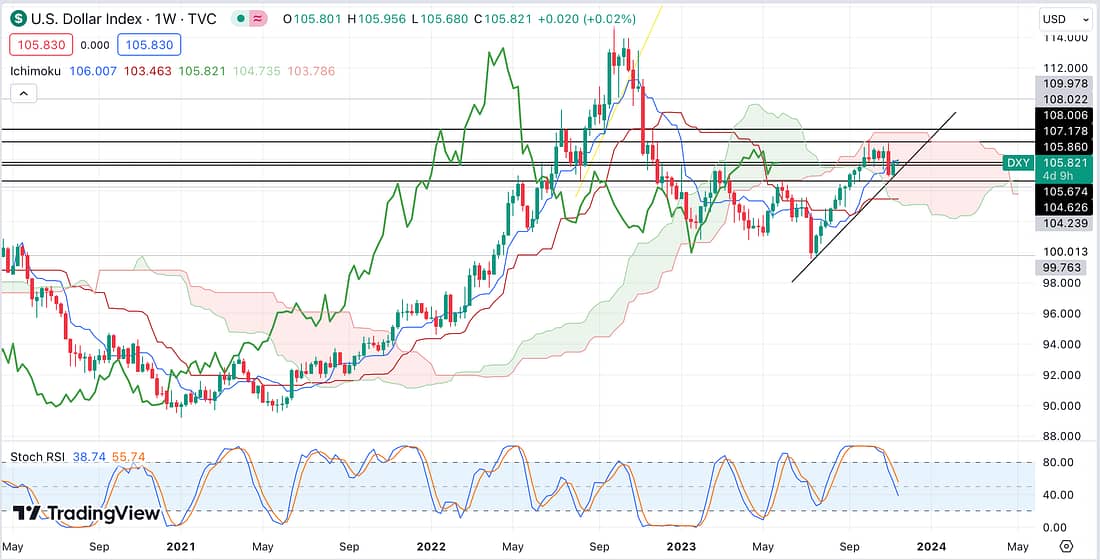
DXY

As shown above, the USD’s weekly timeframe suggests that the price action is likely to continue moving side-ways for the next week or so, as the Stochastic RSI heads downwards towards the oversold position.
This means that I will not be expecting the price of Gold to move substantially in response. When the price of the US dollar goes up this tends to cause the price of gold to go down. And when the US dollar goes down, it tends to cause the price of gold to rise.
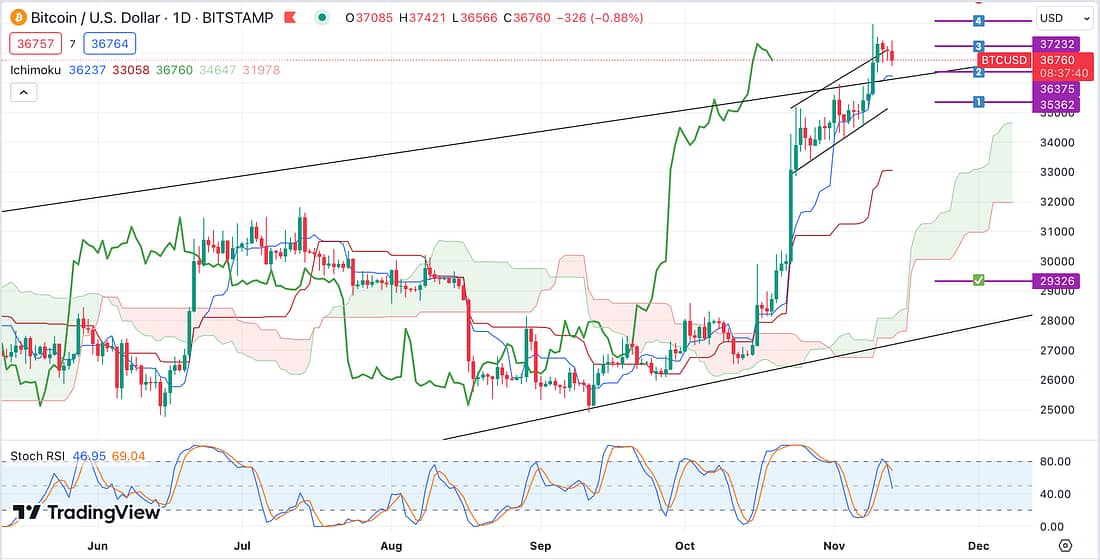
BTC

As can be seen above, BTC is starting to pull-back on the daily timeframe. However, the weekly Stochastic RSI is still in the overbought position, high above the 80.00 threshold. This suggest that there is still a lot of bull strength to stop a strong decline.
SOUTHERN COOPER CORP TRADE

Trade seems to be playing out according to plan. Expecting the price to further decline as the price of copper reduces in light of a slowing economy.
Let’s see how this continues to play out!
WATCHLIST
In light of putting on about 11 trades, working through my watchlist required a lot of mental exertion.
This is because I have to assess the likely direction of the price action of each asset in light of their trend lines, the Ichimoku indicator, Stochastic RSIs, and different timeframes.
Learning Point
- Strategically, I have to workout when it will be worthwhile copying and commenting on the latest price movements of my current trades. I guess it makes sense to do so when the trade has reached my price target level or when I have decided to close the trade for some reason.
- The upside: quickly assessing numerous financial markets and assets everyday will enable me to develop, rapidly, advanced trading expertise and experience.
Next Action
- Copy, past, and comment on the latest price chart of any trade when it has taught you something important which your future self will need to remember.
AAPL TRADE

Watching Soloway’s latest trading video drew my attention to another trend line that could be drawn in relation to Apple’s current price movement. Soloway encouraged his viewers to draw trend lines in the knowledge that there isn’t necessarily a right or wrong way to do it, but rather that it lends itself to experimentation.
As can be seen above, the trend line rising from south-west to north-east indicates that there is now a high probability that AAPL’s price will start declining due to the confluence of selling pressure.
Nonetheless, when declining, the price can behave in several different ways: (1) move straight down forming an upside down V shape, (2) move down at a slight angle like at 45 degrees, or (3) move sideways.
MSFT TRADE

I decided to short trade Microsoft today because its price action seems to present a high probability of a price decline, similar to NVDA, TQQQ, AMZN, SPY, and AAPL.
It is not coincidence that all of these different stocks and markets have a similar price pattern as they all relate to the technology sector and reflect the general direction of the stock market as a whole.
Let’s see how this trade plays out!
Learning Point
- Trading the daily timeframe appears to require about 1 to 2 weeks (5-10 days: 5-10 candles) for the price action to confirm or reject the technical analysis: price movement in relation to the trend lines and the relevant support and resistance levels.
- Reminded that if the US10 Year Yield falls, it encourages the stock market to rise (people are no longer buying bonds, but are buying stocks). This seems to be the case, even when the US dollar is moving sideways.
Next Action
- Continue to place numerous high probability trades using the daily timeframe.
- Continue to assess the charts and your current trades everyday using the daily timeframe to determine when the take-profits, adjust your stop-losses, close your trades, and open new trading positions.
IVG (Involgize)