Trading Watchlist:
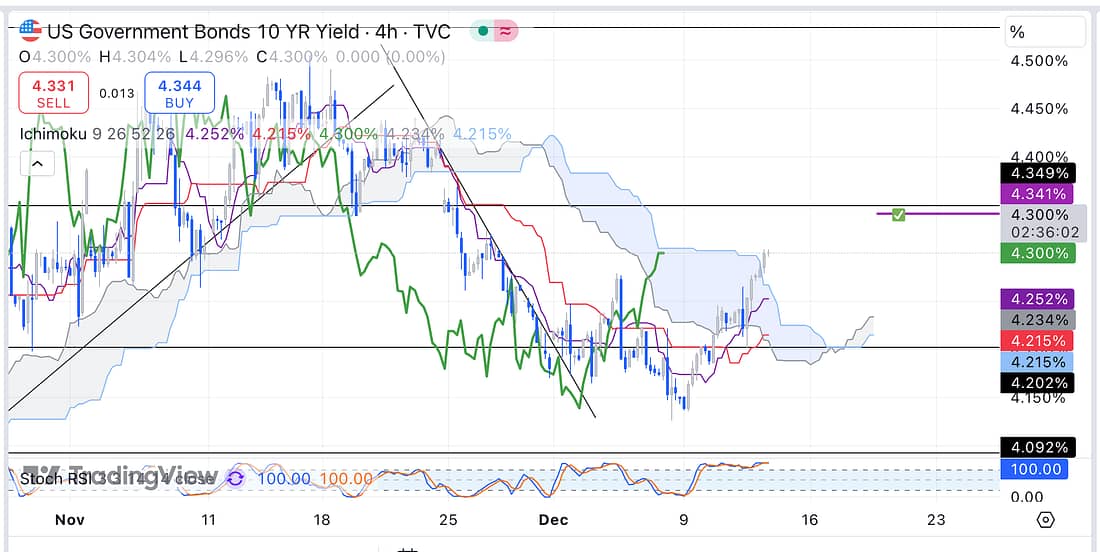
1. US10Y

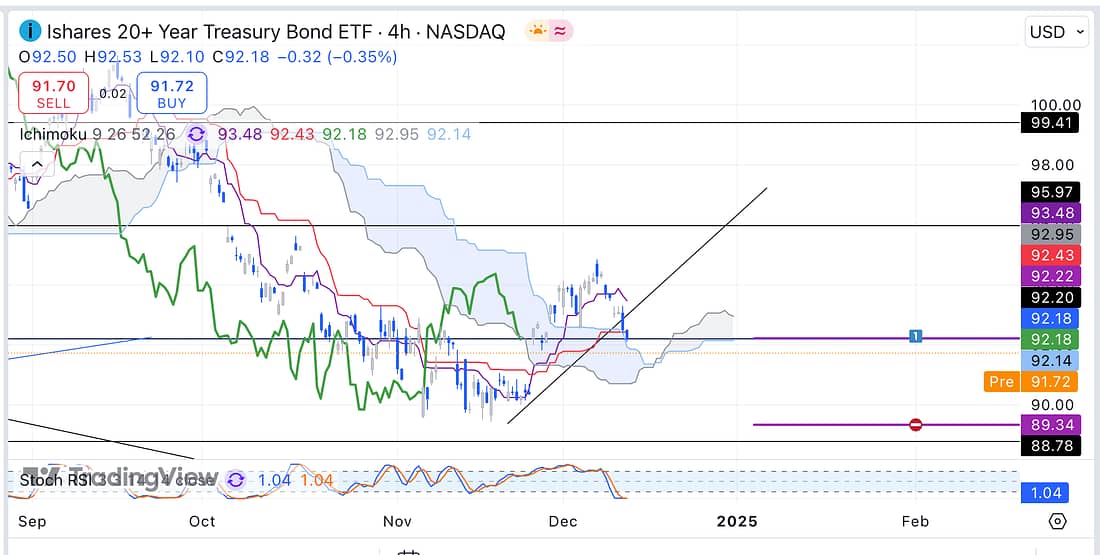
As can be seen above, the US10Y looks highly likely to move up to the next resistance level on the daily timeframe. In addition, the US10 (below) is at present showing a bearish price action structure on the 4 hour timeframe. It makes sense, therefore, to exit my TLT position because it is currently at my initial entry level:
2. TLT

3. US10

4. BTC – analysed.
5. TIGR – analysed.
6. BIDU – analysed.
7. MARA – analysed.
8. CMG – analysed: move stop-loss to entry level now.
9. DG – analysed.
10. UVXY – analysed.
11. JETS – analysed.
12. UAL – analysed.
13. SFM – analysed.
14. COST – analysed.
15. WMT – analysed.
16. AXP – analysed.
17. PALL – still no man’s land.
18. BTC.D – analysed.
19. XAUUSD – analysed.
20. USOIL – analysed: still ranging.
21. NATGAS – analysed.
22. FDX – analysed.
23. SOXX – analysed: still ranging.
24. INTC – analysed: still declining strongly on the weekly timeframe.
25. VLVLY – still ranging.
26. RUT – intriguingly, RUT still maintaining its bullish price action structure.
Learning Points
- TLT reminded me of the importance of learning how to exit losing position automatically and as quickly as possible. This is why knowing how to trade profitably is an extremely difficult skill for the average person to master, as it requires consistent training and psychological re-wiring.
Next Actions
- Exit TLT position as soon as possible.
- Update new trading spreadsheet with the latest losing TLT trade.
